- Page 1 and 2:
7,2/H5 Self-assembled Transition Me
- Page 3 and 4:
, Phone orr. 0484-2575804 ; Phone R
- Page 5 and 6:
‘ilC7(,'NO’WLQ'I(D QEMEWT In tl
- Page 7 and 8:
PREFACE In its method, chemistry is
- Page 9 and 10:
CONTENTS CHAPTER 1 Introduction to
- Page 11 and 12:
4.3.5. Magnetochemistry 4.3.6. Char
- Page 13 and 14:
Chapter I__ _ _ irreducible, is a n
- Page 15 and 16:
Chapter I W 7 _ W _ 7 pg _ jg to pr
- Page 17 and 18:
Chapter I H_ g g 7 g 7 7 __ harvest
- Page 19 and 20:
Chapter I _ _ ______g__H _ g involv
- Page 21 and 22:
Chapter I _ g plays a pivotal role
- Page 23 and 24:
Chapter I g g _ exhibit considerabl
- Page 25 and 26:
Chapter I _, assemblies to generate
- Page 27 and 28:
Chapter I _ ,_ of mono or dinuclear
- Page 29 and 30:
Chapter I M W 7 7 _ __ 1.3.1.1. Ant
- Page 31 and 32:
Chapter I _ _ _ _ \_ 4- Jm _. _.
- Page 33 and 34:
Chapter In g_ g _ E __ _ E __( > es
- Page 35 and 36:
Chapter I W__‘ _ 1.6.6. MALDI MS
- Page 37 and 38:
Chapter I ,,_ g electron spin (the
- Page 39 and 40:
Chapter I W _ _ Traditional magnets
- Page 41 and 42:
Chapter I L.K. Thompson, O. Waldman
- Page 43 and 44:
Chapter I i __ _ Org. Chem. 31 (200
- Page 45 and 46:
Chapter In _g , g H g 85. S. Padhye
- Page 47 and 48:
Chapter 2 1 g anticipation of Cu(H)
- Page 49 and 50: Chapter 2 _. M_ _ up 1. Quinoline-2
- Page 51 and 52: Chapter 2 chloroform solution and d
- Page 53 and 54: Chapter2 V _ _ _ _, 7 _ with aceton
- Page 55: Chapter 2 _ 7 f __ i 2.3. Results a
- Page 58 and 59: 100s0- I > J 20
- Page 60 and 61: — — 1 Ligands 1
- Page 62 and 63: Ligands The ‘H and "C NMR spectra
- Page 64 and 65: Ligands The ‘H NMR spectrum of HZ
- Page 66 and 67: M1 1‘ 11 IL; Fig. 2.11. 'H NMR sp
- Page 68 and 69: ' | Ligands uo no 1&0 150 no no no
- Page 70 and 71: Ligands Table 2. 3. Crystal data an
- Page 72 and 73: Ligands The C-S bond distances of 1
- Page 74 and 75: ligands between the planes of Cg(2)
- Page 76 and 77: " F Ligands A indicates a typical d
- Page 78 and 79: ' ' Q 0' ¢ ¢" .~ 0~ I Q Q Q \ ' Q
- Page 80 and 81: 2.4.2. M TT Cell Proliferation Assa
- Page 82 and 83: Table 2.9. Cell proliferation effec
- Page 84 and 85: 7 y _ i _ W Ligands B. Moubaraki, K
- Page 86 and 87: CHAPTER Ni(II) complexes of carbohy
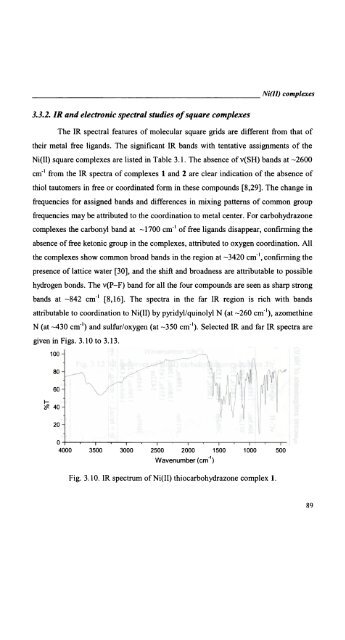
- Page 88 and 89: _ _ __ g_ g W g H__ Ni(ll) complexe
- Page 90 and 91: _ g A __ Ni(lI) complexes The reddi
- Page 92 and 93: 3.3. Results and discussion g_g _ N
- Page 94 and 95: 3.3.1. MALDI MS spectral studies of
- Page 96 and 97: Ni(Il) complexes In the case of com
- Page 98 and 99: 100 U-
- Page 102 and 103: Ni(II) complexes -40- 100 1 , 80s
- Page 104 and 105: 25' 06 2.0M00 00-‘. I Ni(l
- Page 106 and 107: Ni(II) complexes 100-1- 80- J I\ an
- Page 108 and 109: 15 30 1.2 - 2'5 TX ' 2.0 1 0.0-
- Page 110 and 111: } 1 ’/_. 6 1! 7 /1"“ |‘\»l [
- Page 112 and 113: ’ Ni(II) complexes Fig. 3.20.
- Page 114 and 115: __ it l Ni(Il) complexes Fig. 3.22.
- Page 116: Table 3.8. Relevant interactions in
- Page 119 and 120: Chapter 3 '\ § C23 C22 i ii _l_ ;
- Page 121 and 122: Chapter 3 angles N(1)—Ni(1)—S(1
- Page 123 and 124: Chapter 3 ‘ r . _ 9 ' . I 1 . *..
- Page 125 and 126: Chapter 3 = -2J1{§, -3*, +.§, -$1
- Page 127 and 128: Chapter 3 antiferromagnetic couplin
- Page 129 and 130: 06- 7 5- - -‘I _'l l I l I ' I |
- Page 131 and 132: Chapter 3 _ g__ g pg 7 it is small,
- Page 133 and 134: Chapter3 y 7 __ _ V. Suni, M.R.P. K
- Page 135 and 136: @@M3 7 yy _ 57. J.B. Goodenough, J.
- Page 137 and 138: Chapter 4 observed [3]. Conversely,
- Page 139 and 140: Chapter 4 _, W washed with methanol
- Page 141 and 142: Chapter 4 _ f A _, [Cu;(HL4)Br_;]Br
- Page 143 and 144: Chapter-4 __ U g __ ,7 thermodynami
- Page 145 and 146: Chapter 4 exact position of anions
- Page 147 and 148: Chapter 4 compounds has been very l
- Page 149 and 150: ' Chapter 4 M; we .0 1 70-1 00» 3.
- Page 151 and 152:
Chapter 4 The spectrum of Cu(II) ca
- Page 153 and 154:
Chapter 4 4.3.2. IR spectral studie
- Page 157 and 158:
Chapter 4 146 100..‘ r “ .\
- Page 159 and 160:
Chapter 4 4.3.3. Electronic spectra
- Page 161 and 162:
Chapter 4 o'a6o 20 l 300 400 500 00
- Page 163 and 164:
Chapter 4 4.3.4. EPR spectral studi
- Page 166 and 167:
C0pper(II) complexes The spectrum o
- Page 168 and 169:
the biomimetic (N, O or S) donors r
- Page 170 and 171:
Copper(Il) complexes different spec
- Page 172 and 173:
l F/’ Copper(II) complexes l L .1
- Page 174 and 175:
C0pper(II) complexes The carbohydra
- Page 176 and 177:
J K” ‘ | | | | | | | 263 2&3 3]
- Page 178 and 179:
C 0pper( II ) complexes rise to rho
- Page 180 and 181:
V,‘ _| _I> I / tux '1'] V /fr
- Page 182 and 183:
C0pper(ll) complexes The room tempe
- Page 184 and 185:
2.5 2.0 1.5 0.5 — I O _ . . ..
- Page 186 and 187:
_ - |'|'|'|'|'|'|'1' I C0pper(II)
- Page 188 and 189:
2.5 — 2.0 1.5 — 1.0- I I '1‘
- Page 190 and 191:
Copper(II) complexes When two or mo
- Page 192 and 193:
C 0pper( ll ) complexes bis[(1E)-1-
- Page 194 and 195:
C0pper(II) complexes The powder spe
- Page 197 and 198:
Chapter 4 Table 4.5. Crystal data a
- Page 199 and 200:
Chapter 4 Table 4.7. Cell survival
- Page 201 and 202:
Chapter 4 _ g g ,4 pp if magnetic s
- Page 203 and 204:
Chapter 4 g _, 17 18 19 20 21 22 23
- Page 205 and 206:
Chapter 4 7 W *_ ?_ _ _ 53. Y.D. La
- Page 207 and 208:
Chapter 5 _ g _ g g _g_ g _g magnet
- Page 209 and 210:
Chapter5 __ ,4 4 4 4 __ _, after th
- Page 211 and 212:
Chapter 5 _ H _ g g A temperature,
- Page 213 and 214:
Chapter 5 5.3.1. AIALDI MS spectral
- Page 215 and 216:
Chapter 5 The spectrum of 20 shows
- Page 217 and 218:
Chapter 5 The peaks of complex 22 a
- Page 219 and 220:
Chapter 5 lower than cubic. However
- Page 221 and 222:
Chapter 5 value of 265 MI-lz (94.9
- Page 223 and 224:
Chapter 5 Broad signals above g=2,
- Page 225 and 226:
Chapter 5 5.3.3. IR and electronic
- Page 228 and 229:
Manganese(ll) complexes .l 70 60
- Page 230 and 231:
5.3.4. Magnetochemistry Manganese(l
- Page 232 and 233:
Manganese(lI) complexes The best-fi
- Page 234 and 235:
ml lManganese(Il) complexes 4-5 "I
- Page 236 and 237:
W 7 N A _ gm g_ g Manganesefll) com
- Page 238 and 239:
_, f _ ,_ Manganesefll) complexes L
- Page 240 and 241:
_ {{{{ o SIX CHAPTER Self-assembled
- Page 242 and 243:
pg p_ g g _ Zinc(lI) & Cadmiumfll)
- Page 244 and 245:
g pg __ V g A Zinc(II) & Cadmium(II
- Page 246 and 247:
__ A A A __AA_*_Ag Zinc(Il) & Cadmi
- Page 248 and 249:
6.3.1 . MALDI MS spectral studies Z
- Page 250 and 251:
Zinc(Il) & Cadmium(lI) complexes 24
- Page 252 and 253:
Zinc(lI) & Cadmium(lI) complexes -
- Page 254 and 255:
Zinc(ll) & Cadmium(II) complexes di
- Page 256 and 257:
Zinc(II) & Cadmium(Il) complexes m
- Page 258 and 259:
ml ~81 70 ‘O . 30. 1. I00. 50 108
- Page 260 and 261:
08 ‘ 00 0.0 07 06 05 Zinc(lI) &
- Page 262:
Zinc(II) & Cadmium(Il) complexes Th
- Page 265 and 266:
Chapter 6 with v |(B—F) at ~777 c
- Page 267 and 268:
Chapter 6 strong v(C=S) bands of fr
- Page 269 and 270:
Chapter 6 6.3.3.1. Crystal structur
- Page 271 and 272:
Chapter 6 comparatively greater tha
- Page 273 and 274:
Chapter 6 Zn(4)=9O.78(l)°}. The Zn
- Page 275 and 276:
Chapter 6 In the crystal packing (F
- Page 277 and 278:
Chapter 6 H 6.4. Concluding remarks
- Page 279 and 280:
Chapter6 H f f _ j i W f W ‘ ,_ A
- Page 281 and 282:
Chapter 6 j ,_ , 40. A.L. Spek,Acta
- Page 283 and 284:
4. 1,5-Bis(di-2-pyridyl ketone) car
- Page 285 and 286:
g g 7 g Self-Assembled Transition M
- Page 287 and 288:
A Self-Assembled Transition Metal C
- Page 289 and 290:
RESEARCH PUBLICATIONS Structural an