- Page 1 and 2:
7,2/H5 Self-assembled Transition Me
- Page 3 and 4:
, Phone orr. 0484-2575804 ; Phone R
- Page 5 and 6:
‘ilC7(,'NO’WLQ'I(D QEMEWT In tl
- Page 7 and 8:
PREFACE In its method, chemistry is
- Page 9 and 10:
CONTENTS CHAPTER 1 Introduction to
- Page 11 and 12:
4.3.5. Magnetochemistry 4.3.6. Char
- Page 13 and 14:
Chapter I__ _ _ irreducible, is a n
- Page 15 and 16:
Chapter I W 7 _ W _ 7 pg _ jg to pr
- Page 17 and 18:
Chapter I H_ g g 7 g 7 7 __ harvest
- Page 19 and 20:
Chapter I _ _ ______g__H _ g involv
- Page 21 and 22:
Chapter I _ g plays a pivotal role
- Page 23 and 24:
Chapter I g g _ exhibit considerabl
- Page 25 and 26:
Chapter I _, assemblies to generate
- Page 27 and 28:
Chapter I _ ,_ of mono or dinuclear
- Page 29 and 30:
Chapter I M W 7 7 _ __ 1.3.1.1. Ant
- Page 31 and 32:
Chapter I _ _ _ _ \_ 4- Jm _. _.
- Page 33 and 34:
Chapter In g_ g _ E __ _ E __( > es
- Page 35 and 36:
Chapter I W__‘ _ 1.6.6. MALDI MS
- Page 37 and 38:
Chapter I ,,_ g electron spin (the
- Page 39 and 40:
Chapter I W _ _ Traditional magnets
- Page 41 and 42:
Chapter I L.K. Thompson, O. Waldman
- Page 43 and 44:
Chapter I i __ _ Org. Chem. 31 (200
- Page 45 and 46:
Chapter In _g , g H g 85. S. Padhye
- Page 47 and 48:
Chapter 2 1 g anticipation of Cu(H)
- Page 49 and 50:
Chapter 2 _. M_ _ up 1. Quinoline-2
- Page 51 and 52:
Chapter 2 chloroform solution and d
- Page 53 and 54:
Chapter2 V _ _ _ _, 7 _ with aceton
- Page 55:
Chapter 2 _ 7 f __ i 2.3. Results a
- Page 58 and 59:
100s0- I > J 20
- Page 60 and 61:
— — 1 Ligands 1
- Page 62 and 63:
Ligands The ‘H and "C NMR spectra
- Page 64 and 65:
Ligands The ‘H NMR spectrum of HZ
- Page 66 and 67:
M1 1‘ 11 IL; Fig. 2.11. 'H NMR sp
- Page 68 and 69:
' | Ligands uo no 1&0 150 no no no
- Page 70 and 71:
Ligands Table 2. 3. Crystal data an
- Page 72 and 73:
Ligands The C-S bond distances of 1
- Page 74 and 75:
ligands between the planes of Cg(2)
- Page 76 and 77:
" F Ligands A indicates a typical d
- Page 78 and 79:
' ' Q 0' ¢ ¢" .~ 0~ I Q Q Q \ ' Q
- Page 80 and 81:
2.4.2. M TT Cell Proliferation Assa
- Page 82 and 83:
Table 2.9. Cell proliferation effec
- Page 84 and 85:
7 y _ i _ W Ligands B. Moubaraki, K
- Page 86 and 87:
CHAPTER Ni(II) complexes of carbohy
- Page 88 and 89:
_ _ __ g_ g W g H__ Ni(ll) complexe
- Page 90 and 91:
_ g A __ Ni(lI) complexes The reddi
- Page 92 and 93:
3.3. Results and discussion g_g _ N
- Page 94 and 95:
3.3.1. MALDI MS spectral studies of
- Page 96 and 97:
Ni(Il) complexes In the case of com
- Page 98 and 99:
100 U-
- Page 100:
3.3.2. IR and electronic spectral s
- Page 103 and 104:
Chapter 3 The electronic spectra of
- Page 105 and 106:
t§hqphw*3 v(Ni—S), further suppo
- Page 107 and 108:
Chapter 3 charge transfer bands. Fo
- Page 109 and 110:
Chapter 3 were refined anisotropica
- Page 111 and 112:
Chapter 3 3.3.3.1. Crystal structur
- Page 113 and 114:
Chapter 3 Table 3.7. Selected bond
- Page 115 and 116:
Chapter 3 N(l3)—C(35), N(2l)-C(58
- Page 118 and 119:
3.3.3.2. Crystal structures 0f[Ni(H
- Page 120 and 121:
Table 3.10. Selected bond lengths (
- Page 122 and 123:
Ni(lI) complexes significant 1t---1
- Page 124 and 125:
3.3.4. Magnetochemistry of the mole
- Page 126 and 127:
Ni(Il) complexes The allowed values
- Page 128 and 129:
in xn In
- Page 130 and 131:
g 7 Ni(Il) complexes 3.4. Concludin
- Page 132 and 133:
11 12 13 14 15 16 17 18 19 20 21 22
- Page 134 and 135:
41 42 43 44 45 46 47 48 49 50 51 52
- Page 136 and 137:
_ g “FOUR CHAPTER Cu(II) complexe
- Page 138 and 139:
_g C0pper(II) complexes complex of
- Page 140 and 141:
_ _ , p f 7, Copper-(II) complexes
- Page 142 and 143:
pp g _g _4_,_ C0pper(II) complexes
- Page 144 and 145:
g _,_,_ g g Copperfll) complexes in
- Page 146 and 147:
i ____ 3+ i --—- C 0pper(H) 2+ co
- Page 148 and 149:
C0pper(Il) complexes 499 100i ~04 7
- Page 150 and 151:
.04Copper(II) complexes 385 50.1I 1
- Page 152 and 153:
100-I 4 -1 U ” Q 7°-J 59-: "1
- Page 154:
C0pper(lI) complexes confirm the po
- Page 158 and 159:
C0pper(ll) complexes 100 80" I
- Page 160 and 161:
C0pper(1l) complexes state, similar
- Page 162 and 163:
2 5 2.5MW 20 Q 1.51 2oo'aoo'45o's
- Page 164:
Copper(lI) complexes F1 = g",3B:S:
- Page 167 and 168:
Chapter 4 for both species consider
- Page 169 and 170:
Chapter 4 The spectrum of compound
- Page 171 and 172:
Chapter 4 stability alone could not
- Page 173 and 174:
Chapter 4 zénzénzénzénénaloeé
- Page 175 and 176:
Chapter 4 164 | | | 252 272 2Q 31 B
- Page 177 and 178:
Chapter 4 The shifting of g values
- Page 179 and 180:
Chapter 4 _|“. / "| 1' '| |' | 1'
- Page 181 and 182:
Chapter 4 The solid state and some
- Page 183 and 184:
Chapter 4 U 1 .I - O i I . I II I
- Page 185 and 186:
_ I Chapter 4 — I I I — I '
- Page 187 and 188:
. , Chapter 4 2.5 I I ' I ' I ' I '
- Page 189 and 190:
Chapter 4 The field dependence of m
- Page 191 and 192:
Chapter 4 Where ,1’ M is the magn
- Page 193 and 194:
Chapter 4 g e The powder and frozen
- Page 195:
Chapter 4 various aspects like bond
- Page 198 and 199:
C0pper(ll) complexes Table 4.6. Sel
- Page 200 and 201: ,____ p _p C0pper(H) complexes from
- Page 202 and 203: Ed. Engl. 31 (1992) 733. 7___7 7 7
- Page 204 and 205: __ ,_ f W C 0pper(l1) complexes Che
- Page 206 and 207: -_ FIVE CHAPTER Spectral and magnet
- Page 208 and 209: __ g_ _g g H g __ Manganese(II) com
- Page 210 and 211: q H _ Manganesefll) complexes [Mn2(
- Page 212 and 213: Manganese(Il) complexes lcmzmoll in
- Page 214 and 215: 1W3 "l U 70 60 40 30 10 490 740 979
- Page 216 and 217: Manganese(II) complexes MALDI MS sp
- Page 218 and 219: 5.3.2. EPR spectral studies Mangane
- Page 220 and 221: Manganese(II) complexes D and E , e
- Page 222 and 223: the pattern is uncertain and it is
- Page 224 and 225: __ I . l r Manganese(II) complexes
- Page 226: " |\ Man ganese(II) complexes 80" 6
- Page 229 and 230: Chapter 5 thiocarbohydrazone comple
- Page 231 and 232: Chapter 5 To fit and interpret the
- Page 233 and 234: Chapter 5 #1 IT 0.00 1 — ‘ I '
- Page 235 and 236: Chapter 5 The temperature dependenc
- Page 237 and 238: Chapter 5 ___ M _ 357 (2004) 2694.
- Page 239 and 240: Chapter5 p _ _ S. Sivakumar, Struct
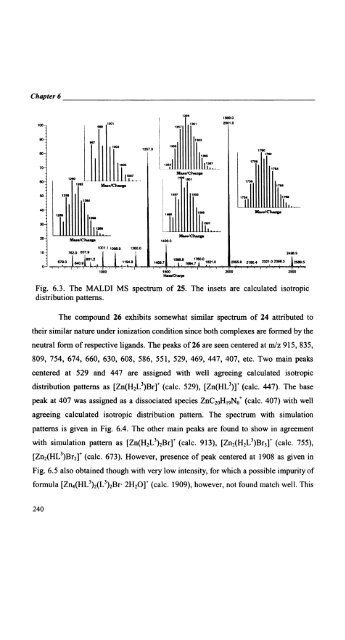
- Page 241 and 242: Chapter 6 _ _ __ 7 the latter have
- Page 243 and 244: Chapter6A, 0 0 _, 0 0 _* 4, W 0 0 0
- Page 245 and 246: Chapter 6 g _ _ [Cd(HL2) ].,(1v0_.)
- Page 247 and 248: Chapter 6 / ‘~ ' if‘ . l \ N N/
- Page 249: 1 | Chapter 6 100m__ ‘ 76$ mi, 16
- Page 253 and 254: Chapter 6 The compound 27 exhibits
- Page 255 and 256: (T71aq7tew'¢5 centered at 1711.9 c
- Page 257 and 258: 1 . 1 Chapter 6 1244 100--1-; 1245
- Page 259 and 260: Chapter 6 6.3.2. Electronic and IR
- Page 261 and 262: Chapter 6 band at 19160 and 23920 c
- Page 264 and 265: Zinc(II) & Cadmium(II) complexes Th
- Page 266 and 267: .- 60- I ‘J TZinc(Il) & Cadmium(l
- Page 268 and 269: Zinc(Il) & Cadmium(Il) complexes re
- Page 270 and 271: Zinc(II) & C admium(ll) complexes T
- Page 272 and 273: Fig. 6.25. The molecular structure
- Page 274 and 275: Zinc(lI) & Cadmium(ll) complexes Al
- Page 276 and 277: Zi!lC(II) & Cadmlum(II) C0mlexes Ta
- Page 278 and 279: V _ i Zinc(1I) & Cadmium(lI) comple
- Page 280 and 281: _ g _ g g V Zinc(lI) & Cadmiumfll)
- Page 282 and 283: _, _ g pg L Summary and conclusion
- Page 284 and 285: W g _ g mm Summary and conclusion a
- Page 286 and 287: __ ,_ _ W A _ _ Summary and conclus
- Page 288 and 289: Curriculum Vitae PERSONAL PROFILE N
- Page 290: 2-Hydroxyacetophenone 4-phenylthios