A Review of Highway Agencies in the South Asia Region
A Review of Highway Agencies in the South Asia Region
A Review of Highway Agencies in the South Asia Region

You also want an ePaper? Increase the reach of your titles
YUMPU automatically turns print PDFs into web optimized ePapers that Google loves.
A <strong>Review</strong> <strong>of</strong> <strong>Highway</strong> <strong>Agencies</strong> <strong>in</strong> <strong>the</strong> <strong>South</strong> <strong>Asia</strong> <strong>Region</strong><br />
India*<br />
Sri Lanka 69.2<br />
Sri Lanka<br />
Nepal<br />
Pakistan<br />
Bangladesh<br />
2.8<br />
8.8<br />
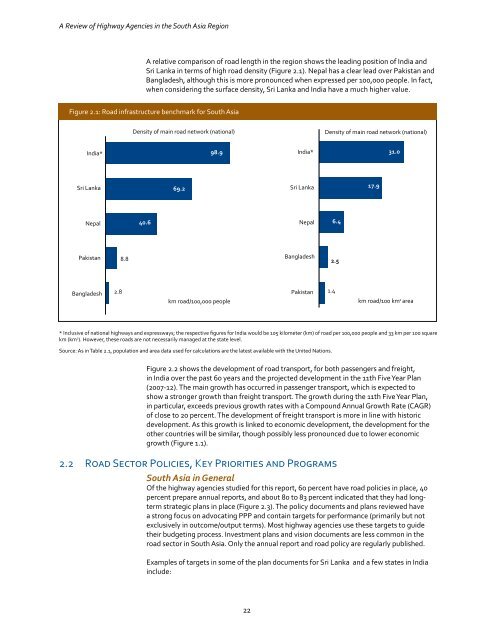
A relative comparison <strong>of</strong> road length <strong>in</strong> <strong>the</strong> region shows <strong>the</strong> lead<strong>in</strong>g position <strong>of</strong> India and<br />
Sri Lanka <strong>in</strong> terms <strong>of</strong> high road density (Figure 2.1). Nepal has a clear lead over Pakistan and<br />
Bangladesh, although this is more pronounced when expressed per 100,000 people. In fact,<br />
when consider<strong>in</strong>g <strong>the</strong> surface density, Sri Lanka and India have a much higher value.<br />
Figure 2.1: Road <strong>in</strong>frastructure benchmark for <strong>South</strong> <strong>Asia</strong><br />
Density <strong>of</strong> ma<strong>in</strong> road network (national) Density <strong>of</strong> ma<strong>in</strong> road network (national)<br />
40.6<br />
98.9<br />
22<br />
India*<br />
Nepal<br />
Bangladesh<br />
Pakistan 1.4<br />
km road/100,000 people 2<br />
km road/100 km area<br />
* Inclusive <strong>of</strong> national highways and expressways; <strong>the</strong> respective figures for India would be 105 kilometer (km) <strong>of</strong> road per 100,000 people and 33 km per 100 square<br />
km (km 2 ). However, <strong>the</strong>se roads are not necessarily managed at <strong>the</strong> state level.<br />
Source: As <strong>in</strong> Table 2.1, population and area data used for calculations are <strong>the</strong> latest available with <strong>the</strong> United Nations.<br />
Figure 2.2 shows <strong>the</strong> development <strong>of</strong> road transport, for both passengers and freight,<br />
<strong>in</strong> India over <strong>the</strong> past 60 years and <strong>the</strong> projected development <strong>in</strong> <strong>the</strong> 11th Five Year Plan<br />
(2007-12). The ma<strong>in</strong> growth has occurred <strong>in</strong> passenger transport, which is expected to<br />
show a stronger growth than freight transport. The growth dur<strong>in</strong>g <strong>the</strong> 11th Five Year Plan,<br />
<strong>in</strong> particular, exceeds previous growth rates with a Compound Annual Growth Rate (CAGR)<br />
<strong>of</strong> close to 20 percent. The development <strong>of</strong> freight transport is more <strong>in</strong> l<strong>in</strong>e with historic<br />
development. As this growth is l<strong>in</strong>ked to economic development, <strong>the</strong> development for <strong>the</strong><br />
o<strong>the</strong>r countries will be similar, though possibly less pronounced due to lower economic<br />
growth (Figure 1.1).<br />
2.2 Road Sector Policies, Key Priorities and Programs<br />
<strong>South</strong> <strong>Asia</strong> <strong>in</strong> General<br />
Of <strong>the</strong> highway agencies studied for this report, 60 percent have road policies <strong>in</strong> place, 40<br />
percent prepare annual reports, and about 80 to 83 percent <strong>in</strong>dicated that <strong>the</strong>y had longterm<br />
strategic plans <strong>in</strong> place (Figure 2.3). The policy documents and plans reviewed have<br />
a strong focus on advocat<strong>in</strong>g PPP and conta<strong>in</strong> targets for performance (primarily but not<br />
exclusively <strong>in</strong> outcome/output terms). Most highway agencies use <strong>the</strong>se targets to guide<br />
<strong>the</strong>ir budget<strong>in</strong>g process. Investment plans and vision documents are less common <strong>in</strong> <strong>the</strong><br />
road sector <strong>in</strong> <strong>South</strong> <strong>Asia</strong>. Only <strong>the</strong> annual report and road policy are regularly published.<br />
Examples <strong>of</strong> targets <strong>in</strong> some <strong>of</strong> <strong>the</strong> plan documents for Sri Lanka and a few states <strong>in</strong> India<br />
<strong>in</strong>clude:<br />
6.4<br />
2.5<br />
17.9<br />
31.0