A Review of Highway Agencies in the South Asia Region
A Review of Highway Agencies in the South Asia Region
A Review of Highway Agencies in the South Asia Region
You also want an ePaper? Increase the reach of your titles
YUMPU automatically turns print PDFs into web optimized ePapers that Google loves.
A <strong>Review</strong> <strong>of</strong> <strong>Highway</strong> <strong>Agencies</strong> <strong>in</strong> <strong>the</strong> <strong>South</strong> <strong>Asia</strong> <strong>Region</strong><br />
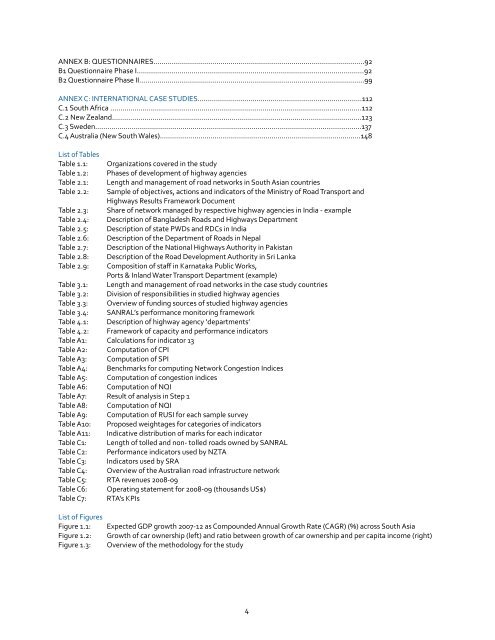
ANNEX B: QUESTIONNAIRES…………………………………………..............................……………..………92<br />
B1 Questionnaire Phase I................................................................................................................ 92<br />
B2 Questionnaire Phase II...............................................................................................................99<br />
ANNEX C: INTERNATIONAL CASE STUDIES.................................................................................112<br />
C.1 <strong>South</strong> Africa ............................................................................................................................112<br />
C.2 New Zealand...........................................................................................................................123<br />
C.3 Sweden...................................................................................................................................137<br />
C.4 Australia (New <strong>South</strong> Wales)...................................................................................................148<br />
List <strong>of</strong> Tables<br />
Table 1.1: Organizations covered <strong>in</strong> <strong>the</strong> study<br />
Table 1.2: Phases <strong>of</strong> development <strong>of</strong> highway agencies<br />
Table 2.1: Length and management <strong>of</strong> road networks <strong>in</strong> <strong>South</strong> <strong>Asia</strong>n countries<br />
Table 2.2: Sample <strong>of</strong> objectives, actions and <strong>in</strong>dicators <strong>of</strong> <strong>the</strong> M<strong>in</strong>istry <strong>of</strong> Road Transport and<br />
<strong>Highway</strong>s Results Framework Document<br />
Table 2.3: Share <strong>of</strong> network managed by respective highway agencies <strong>in</strong> India - example<br />
Table 2.4: Description <strong>of</strong> Bangladesh Roads and <strong>Highway</strong>s Department<br />
Table 2.5: Description <strong>of</strong> state PWDs and RDCs <strong>in</strong> India<br />
Table 2.6: Description <strong>of</strong> <strong>the</strong> Department <strong>of</strong> Roads <strong>in</strong> Nepal<br />
Table 2.7: Description <strong>of</strong> <strong>the</strong> National <strong>Highway</strong>s Authority <strong>in</strong> Pakistan<br />
Table 2.8: Description <strong>of</strong> <strong>the</strong> Road Development Authority <strong>in</strong> Sri Lanka<br />
Table 2.9: Composition <strong>of</strong> staff <strong>in</strong> Karnataka Public Works,<br />
Ports & Inland Water Transport Department (example)<br />
Table 3.1: Length and management <strong>of</strong> road networks <strong>in</strong> <strong>the</strong> case study countries<br />
Table 3.2: Division <strong>of</strong> responsibilities <strong>in</strong> studied highway agencies<br />
Table 3.3: Overview <strong>of</strong> fund<strong>in</strong>g sources <strong>of</strong> studied highway agencies<br />
Table 3.4: SANRAL’s performance monitor<strong>in</strong>g framework<br />
Table 4.1: Description <strong>of</strong> highway agency ‘departments’<br />
Table 4.2: Framework <strong>of</strong> capacity and performance <strong>in</strong>dicators<br />
Table A1: Calculations for <strong>in</strong>dicator 13<br />
Table A2: Computation <strong>of</strong> CPI<br />
Table A3: Computation <strong>of</strong> SPI<br />
Table A4: Benchmarks for comput<strong>in</strong>g Network Congestion Indices<br />
Table A5: Computation <strong>of</strong> congestion <strong>in</strong>dices<br />
Table A6: Computation <strong>of</strong> NQI<br />
Table A7: Result <strong>of</strong> analysis <strong>in</strong> Step 1<br />
Table A8: Computation <strong>of</strong> NQI<br />
Table A9: Computation <strong>of</strong> RUSI for each sample survey<br />
Table A10: Proposed weightages for categories <strong>of</strong> <strong>in</strong>dicators<br />
Table A11: Indicative distribution <strong>of</strong> marks for each <strong>in</strong>dicator<br />
Table C1: Length <strong>of</strong> tolled and non- tolled roads owned by SANRAL<br />
Table C2: Performance <strong>in</strong>dicators used by NZTA<br />
Table C3: Indicators used by SRA<br />
Table C4: Overview <strong>of</strong> <strong>the</strong> Australian road <strong>in</strong>frastructure network<br />
Table C5: RTA revenues 2008-09<br />
Table C6: Operat<strong>in</strong>g statement for 2008-09 (thousands US$)<br />
Table C7: RTA’s KPIs<br />
List <strong>of</strong> Figures<br />
Figure 1.1: Expected GDP growth 2007-12 as Compounded Annual Growth Rate (CAGR) (%) across <strong>South</strong> <strong>Asia</strong><br />
Figure 1.2: Growth <strong>of</strong> car ownership (left) and ratio between growth <strong>of</strong> car ownership and per capita <strong>in</strong>come (right)<br />
Figure 1.3: Overview <strong>of</strong> <strong>the</strong> methodology for <strong>the</strong> study<br />
4


