- Page 2 and 3:
LOS ALAMOS SERIES ON DYNAMIC MATERI
- Page 4 and 5:
University of California Press Berk
- Page 6 and 7:
PART II. EXPLOSIVES PROPERTIES BY P
- Page 8 and 9:
treats pure explosives first, alpha
- Page 10 and 11:
EXPLOSIVES PROPERTIES BY EXPLOSIVE
- Page 12 and 13:
BARATOL 2.3 Shipping.2 Baratol is s
- Page 14 and 15:
BARATOL 6 5.4 Thermal Conductivity.
- Page 16 and 17:
BARATOL 6.2 Detonation Pressure. We
- Page 18 and 19:
BARATOL REFERENCES . . 1. N. I. Sax
- Page 20 and 21:
COMP B slowly. Heating and stirring
- Page 22 and 23:
COMP B 14 3.3 Solubility.‘The sol
- Page 24 and 25:
COMP B 16 5.3 Heat Capacity. Heat C
- Page 26 and 27:
COMP B 18 6.2 Detonation Pressure.
- Page 28 and 29:
COMP B 7.3 Shock Hugoniots.12J8 Com
- Page 30 and 31:
COMP B 9. MECHANICAL PROPERTIES 22
- Page 32 and 33:
CYCLOTOL 1. GENERAL PROPERTIES 1.1
- Page 34 and 35:
CYCLOTOL 26 3.2 Molecular Weight. C
- Page 36 and 37:
CYCLOTOL 4.3 Infrared Spectrum. See
- Page 38 and 39:
CYCLOTOL where D = detonation veloc
- Page 40 and 41:
CYCLOTOL 8.3 Skid Test Results. Den
- Page 42 and 43:
DATB 1. GENERAL PROPERTIES 1.1 Chem
- Page 44 and 45:
DATB 4. PHYSICAL PROPERTIES 4.1 Cry
- Page 46 and 47:
DATB 5.4 Thermal Conductivity, Cond
- Page 48 and 49:
DATB 7.3 Shock Hugoniot.9 Density k
- Page 50 and 51:
HMX* 1. GENERAL PROPERTIES 1.1 Chem
- Page 52 and 53:
HMX 3.2 Molecular Weight. 296.17 3.
- Page 54 and 55:
HMX 5. THERMAL PROPERTIES 46 5.1 Ph
- Page 56 and 57:
HMX 6. DETONATION PROPERTIES 6.1 De
- Page 58 and 59:
HMX 7.3 Shock Hugoniots.” Density
- Page 60 and 61:
NITROGUANIDINE 1. GENERAL PROPERTIE
- Page 62 and 63:
NQ 54 4.2 Density.’ Crystal Metho
- Page 64 and 65:
NQ 56 5.6 Heats of Combustion and F
- Page 66 and 67:
NQ 6.2 Detonation Pressure. There a
- Page 68 and 69:
NQ 8. SENSITIVITY 8.1 Drop Weight I
- Page 70 and 71:
OCTOL These are shipped to an ordna
- Page 72 and 73:
64 OCTOL 3.3 Solubility.6 The solub
- Page 74 and 75:
OCTOL 5. THERMAL PROPERTIES 66 5.1
- Page 76 and 77:
OCTOL 68 6.4 Plate Dent Test Result
- Page 78 and 79:
OCTOL 8.3 Skid Test Results. Weight
- Page 80 and 81:
PBX 9011 1. GENERAL PROPERTIES 1.1
- Page 82 and 83:
PBX 9011 3.3 Solubility. The solubi
- Page 84 and 85:
PBX 9011 76 5.5 Coefficient of Ther
- Page 86 and 87:
PBX 9011 78 6.3 Cylinder Test Resul
- Page 88 and 89:
PBX 9011 7.5 Detonation Failure Thi
- Page 90 and 91:
PBX 9011 82 9.3 Compressive Strengt
- Page 92 and 93:
PBX9404 1. GENERAL PROPERTIES 1.1 C
- Page 94 and 95:
PBX 9404 86 3.2 Molecular Weight. C
- Page 96 and 97:
PBX 9404 88 4.3 Infrared Spectrum.
- Page 98 and 99:
PBX 9404 > 1 1 o- r 0 I I I, / PYRO
- Page 100 and 101:
PBX 9404 7. SHOCK INITIATION PROPER
- Page 102 and 103:
PBX 9404 7.5 Detonation Failure Thi
- Page 104 and 105:
PBX 9404 8.5 Spark Sensitivity. Ele
- Page 106 and 107:
PBX 9404 REFERENCE‘S 1. Committee
- Page 108 and 109:
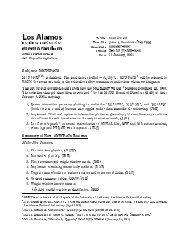
PBX 9407 2.3 Shipping.2 PBX-9407 mo
- Page 110 and 111:
PBX 9407 4.3 Infrared Spectrum. See
- Page 112 and 113:
PBX 9407 6. DETONATION PROPERTIES I
- Page 114 and 115:
PBX 9407 106 7.2 Wedge Test Results
- Page 116 and 117:
PBX 9407 9.3 Compressive Strength a
- Page 118 and 119:
PBX 9501 2.3 Shipping.* PBX-9501mol
- Page 120 and 121:
PBX 9501 5. THERMAL PROPERTIES 112
- Page 122 and 123:
PBX 9501 6. DETONATION PROPERTIES 6
- Page 124 and 125:
PBX 9501 7.3 Shock Hugoniot. Densit
- Page 126 and 127:
PBX 9501 9. MECHANICAL PROPERTIES*
- Page 128 and 129:
PBX9502 1. GENERAL PROPERTIES 1.1 C
- Page 130 and 131:
PBX 9502 3.3 Solubility. The solubi
- Page 132 and 133:
PBX 9502 124 5.3 Heat Capacity. 5.4
- Page 134 and 135:
PBX 9502 6.3 Cylinder Test Results.
- Page 136 and 137:
PBX 9502 9. MECHANICAL PROPERTIES 1
- Page 138 and 139:
PENTAERYTHRITOLTETRANITRATE (PETN)
- Page 140 and 141:
PETN 3.2 Molecular Weight. 316.15 3
- Page 142 and 143:
PETN 4.4 Refractive Indices.s Omega
- Page 144 and 145:
PETN 5.7 Thermal Decomposition Kine
- Page 146 and 147:
PETN 138 7.2 Wedge Test Results. De
- Page 148 and 149:
, PETN 5. US Army Materiel Command,
- Page 150 and 151:
RDX developed into a continuous hig
- Page 152 and 153:
RDX 4. PHYSICAL PROPERTIES 4.1 Crys
- Page 154 and 155:
RDX 146 5.2 Vapor Pressure.8 Temper
- Page 156 and 157:
RDX 6. DETONATION PROPERTIES 148 6.
- Page 158 and 159:
RDX 7.3 Shock Hugoniot.” 8. SENSI
- Page 160 and 161:
TATB 1. GENERAL PROPERTIES 1.1 Chem
- Page 162 and 163:
TATB TATB solubility in sulfuric ac
- Page 164 and 165:
TATB 5.2 Vapor Pressure.6 A least s
- Page 166 and 167:
TATB I / / I I I I I I I ! \ I 1 \
- Page 168 and 169:
TATB 7.3 Shock Hugoniots.“+ A num
- Page 170 and 171:
TATB REFERENCES 1. T. M Benziger an
- Page 172 and 173:
TETRYL acetone. In the second proce
- Page 174 and 175:
TETRYL 2.5 100 80 60 % T 40 20 0 :;
- Page 176 and 177:
TETRYL 6. DETONATION PROPERTIES 6.1
- Page 178 and 179:
TETRYL 7.5 Detonation Failure Thick
- Page 180 and 181:
TNT 1. GENERAL PROPERTIES 1.1 Chemi
- Page 182 and 183:
TNT 4. PHYSICAL PROPERTIES 4.1 Crys
- Page 184 and 185:
TNT 4.3 Infrared Spectrum. See Fig.
- Page 186 and 187:
TNT 178 5.5 Coefficient of Thermal
- Page 188 and 189:
TNT The charge preparation method a
- Page 190 and 191:
TNT 182 6.4 Plate Dent Test Results
- Page 192 and 193:
TNT 7.3 Shock Hugoniots.2aJ4 Densit
- Page 194 and 195:
TNT 9.3 Compressive Strength and Mo
- Page 196 and 197:
XTX8003 1. GENERAL PROPERTIES 1.1 C
- Page 198 and 199:
XTX 8003 3.3 Solubility.6 The solub
- Page 200 and 201:
XTX 8003 5.7 Thermal Decomposition
- Page 202 and 203:
XTX 8003 8. SENSITIVITY 8.1 Drop We
- Page 204 and 205:
XTX8004 1. GENERAL PROPERTIES 1.1 C
- Page 206 and 207:
XTX 8004 3.3 Solubility. The solubi
- Page 208 and 209:
XTX 8004 6. DETONATION PROPERTIES 6
- Page 210 and 211:
PART II EXPLOSIVES PROPERTIES BY IP
- Page 212 and 213:
Explosive Alex/20 Alex/30 Amatex/20
- Page 214 and 215:
Explosive PBX 9007 PBX 9010 PBX 901
- Page 216 and 217:
Explosive Constituents X-0234-60 X-
- Page 218 and 219:
Alex/20 Alex/30 Amatexl20 Amatexl30
- Page 220 and 221:
NQ octo1 PAT0 Explosive PBX 9007 PB
- Page 222 and 223:
X-0234-60 X-0234-70 X-0234-80 X-028
- Page 224 and 225:
THERMAL PROPERTIES 2. THERMAL PROPE
- Page 226 and 227:
THERMAL PROPERTIES k2 = kl - (4, -
- Page 228 and 229:
Explosive PETN RDX TNT Table 2.03 C
- Page 230 and 231:
THERMAL PROPERTIES AEE = standard i
- Page 232 and 233:
THERMAL PROPERTIES Fig. 2.02. Pyrol
- Page 234 and 235:
,’ THERMAL PROPERTIES L Y !s :: B
- Page 236 and 237:
THERMAL PROPERTIES 228 Composition
- Page 238 and 239:
THERMAL PROPERTIES B Y !3 E E “I
- Page 240 and 241:
THERMAL PROPERTIES This assembly is
- Page 242 and 243:
DETONATION PROPERTIES 3. DETONATION
- Page 244 and 245:
DETONATION PROPERTIES 236 Table 3.0
- Page 246 and 247:
Shot No. c-4394 E-4672 E-4067 E-406
- Page 248 and 249:
DETONATION PROPERTIES Table 3.06 CY
- Page 250 and 251:
Table 3.08 OCTOL DETONATION VELOCIT
- Page 252 and 253:
Rate Stick Shot ’ Diameter No. (m
- Page 254 and 255: DETONATION PROPERTIES 246 Table 3.1
- Page 256 and 257: Shot No. C-4436 E-3621 - Rate Stick
- Page 258 and 259: Table 3.15 GENERAL CYLINDER TEST SH
- Page 260 and 261: DETONATION PROPERTIES 252 Expansion
- Page 262 and 263: Expansion Radius (mm) Table 3.19 X-
- Page 264 and 265: N VI UY Table 3.21 X-0285 WALL VELO
- Page 266 and 267: DETONATION PROPERTIES Table 3.25 X-
- Page 268 and 269: Explosive Table 3.26 DETONATION (C-
- Page 270 and 271: DETONATION PROPERTIES Analysis Line
- Page 272 and 273: DETONATION PROPERTIES Explosive Tab
- Page 274 and 275: DETONATION PROPERTIES Explosive Tab
- Page 276 and 277: DETONATION PROPERTIES Explosive Tab
- Page 278 and 279: DETONATION PROPERTIES Explosive Tab
- Page 280 and 281: DETONATION PROPERTIES Explosive Tab
- Page 282 and 283: DETONATION PROPERTIES Explosive Tab
- Page 284 and 285: DETONATION PROPERTIES Explosive Tab
- Page 286 and 287: DETONATION PROPERTIES Explosive Tab
- Page 288 and 289: DETONATION PROPERTIES 3.4 Plate Den
- Page 290 and 291: Exnlosive Table 3.46 (continued) De
- Page 292 and 293: Explosive PBX 9501 x-0007 86 HMX/14
- Page 294 and 295: 85 RDX/lS Kel-F Explosive 88 RDXI12
- Page 296 and 297: DETONATION PROPERTIES Table 3.47 LE
- Page 298 and 299: DETONATION PROPERTIES Table 3.48 DE
- Page 300 and 301: SHOCK INITIATION PROPERTIES PETN Ba
- Page 302 and 303: SHOCK INITIATION PROPERTIES Fig. 4.
- Page 306 and 307: SHOCK INITIATION’PROPERTIES Table
- Page 308 and 309: SHOCK INITIATION PROPERTIES 300 i;
- Page 310 and 311: w R Table 4.04 NITROMETHANE Composi
- Page 312 and 313: SHOCK INITIATION PROPERTIES 304 Tab
- Page 314 and 315: SHOCK INITIATION PROPERTIES 306 / D
- Page 316 and 317: SHOCK INITIATION PROPERTIES 308 2 0
- Page 318 and 319: Table 4.06 (continued) Coordinates
- Page 320 and 321: SHOCK INITIATION PROPERTIES 312 I-
- Page 322 and 323: SHOCK INITIATION PROPERTIES 314 4 3
- Page 324 and 325: SHOCK INITIATION PROPERTIES 316 05
- Page 326 and 327: Table 4.07 PETN (SINGLE CRYSTAL) Co
- Page 328 and 329: Table 4.08 (continued) Shot Number
- Page 330 and 331: SHOCK INITIATION PROPERTIES 322 20
- Page 332 and 333: SHOCK INITIATION PROPERTIES 324 2 u
- Page 334 and 335: SHOCK INITIATION PROPERTIES 326 2 0
- Page 336 and 337: SHOCK INITIATION PROPERTIES Table 4
- Page 338 and 339: SHOCK INITIATION PROPERTIES Table 4
- Page 340 and 341: SHOCK INITIATION PROPERTIES Table 4
- Page 342 and 343: SHOCK INITIATION PROPERTIES 334 2T
- Page 344 and 345: SHOCK INITIATION PROPERTIES 336 2 2
- Page 346 and 347: SHOCK INITIATION PROPERTIES 338 2 0
- Page 348 and 349: Initial Shock Parameters Table 4.12
- Page 350 and 351: SHOCK INITIATION PROPERTIES 342 Ini
- Page 352 and 353: SHOCK INITIATION PROPERTIES Table 4
- Page 354 and 355:
3 *a i 8 3 x j > f m e c u,, = (2.3
- Page 356 and 357:
SHOCK INITIATION PROPERTIES 348 Dis
- Page 358 and 359:
w ul 0 Composition 95 wt% DATB, 5 w
- Page 360 and 361:
SHOCK INITIATION PROPERTIES 5.5- 5.
- Page 362 and 363:
5 Table 4.17 (continued) Coordinate
- Page 364 and 365:
SHOCK INITIATION PROPERTIES 356 2 9
- Page 366 and 367:
SHOCK INITIATION PROPERTIES 40- 20
- Page 368 and 369:
Shot E-3120 3.370 $0.022 E-3131 2.4
- Page 370 and 371:
_. Shot Number E-771 E-781 B-4481 B
- Page 372 and 373:
SHOCK INITIATION PROPERTIES 364 2 I
- Page 374 and 375:
SHOCK INITIATION PROPERTIES 366 0.6
- Page 376 and 377:
SHOCK INITIATION PROPERTIES 368 20
- Page 378 and 379:
SHOCK INITIATION PROPERTIES Composi
- Page 380 and 381:
Table 4.21 X-0219-50-14-10 Composit
- Page 382 and 383:
SHOCK INITIATION PROPERTIES 374 3 2
- Page 384 and 385:
Composition 95 wt% NQ, 5 wt% Estane
- Page 386 and 387:
Shot Number (G?a) E-3245 16.2 5.904
- Page 388 and 389:
SHOCK INITIATION PROPERTIES 380 c x
- Page 390 and 391:
w R Table 4.24 (continued) Reduced
- Page 392 and 393:
Table 4.25 XTX-8003 (EXTEX) Composi
- Page 394 and 395:
SHOCK INITIATION PROPERTIES 386 a--
- Page 396 and 397:
Table 4.27 PBX 9407 Compositon 94 w
- Page 398 and 399:
SHOCK INITIATION PROPERTIES 390 3 g
- Page 400 and 401:
Table 4.28 PBX 9405 Cotiposition 93
- Page 402 and 403:
SHOCK INITIATION PROPERTIES 394 c 5
- Page 404 and 405:
% OY Table 4.30 x-0250-40-19 Compos
- Page 406 and 407:
SHOCK INITIATION PROPERTIES 398 Dis
- Page 408 and 409:
Table 4.32 95 TATB/2.5 Kel-F 800/2.
- Page 410 and 411:
SHOCK INITIATION PROPERTIES 402 Tab
- Page 412 and 413:
SHOCK INITIATION PROPERTIES 404 Tab
- Page 414 and 415:
SHOCK INITIATION PROPERTIES 406 Tab
- Page 416 and 417:
Table 4.39 (continued) Coordinates
- Page 418 and 419:
SHOCK INITIATION PROPERTIES Table 4
- Page 420 and 421:
SHOCK INITIATION PROPERTIES Table 4
- Page 422 and 423:
z Table 4.44 FKM CLASS VII PROPELLA
- Page 424 and 425:
SHOCK INITIATION PROPERTIES Table 4
- Page 426 and 427:
SHOCK INITIATION PROPERTIES Table 4
- Page 428 and 429:
Theoretical Maximum Density >1.910
- Page 430 and 431:
SHOCK INITIATION PROPERTIES 422 Tab
- Page 432 and 433:
SHOCK INITIATION PROPERTIES Table 4
- Page 434 and 435:
Ammonium picrate Raratol(76/24) mix
- Page 436 and 437:
HMX-Based PBX 9011 PBX 9404 PBX-950
- Page 438 and 439:
SHOCK INITIATION PROPERTIES 0.360 c
- Page 440 and 441:
SHOCK INITIATION PROPERTIES 432 I I
- Page 442 and 443:
SHOCK INITIATION PROPERTIES Fig. 4.
- Page 444 and 445:
SHOCK INITIATION PROPERTIES Explosi
- Page 446 and 447:
SHOCK INITIATION PROPERTIES Table 4
- Page 448 and 449:
SHOCK INITIATION PROPERTIES TRANSIT
- Page 450 and 451:
SHOCK INITIATION PROPERTIES 442 FOI
- Page 452 and 453:
SHOCK INITIATION PROPERTIES 444 Tab
- Page 454 and 455:
SENSITIVITY TESTS 5. SENSITIVITY TE
- Page 456 and 457:
Ammonium nitrate Ammonium picrate B
- Page 458 and 459:
-’ .-- _- ..- _ “. Cyclotol75/2
- Page 460 and 461:
Explosive RDX-Based with Metal Fill
- Page 462 and 463:
SENSITIVITY TESTS 5.2 Skid Test. Th
- Page 464 and 465:
Explosive Comp A-3 1.638 45 PBX 901
- Page 466 and 467:
SENSITIVITY TESTS 5.3 Large-Scale D
- Page 468 and 469:
SENSITIVITY TESTS 5.4 Spark Sensiti
- Page 470 and 471:
GLOSSARY ABH Amatex-20 ATNI BDNPA B
- Page 472 and 473:
NP OFHC ONT P-16 P-22 P-40 P-80 P-1
- Page 474 and 475:
AUTHOR IND Ablard, J. E. 141, 151 A
- Page 476 and 477:
SUBJECT INDEX ABH 461 Alex/20 204,
- Page 478 and 479:
pentaerythritol tetranitrate (PETN)