- Page 1 and 2:
Evidence Report/Technology Assessme
- Page 3 and 4:
This report is based on research co
- Page 5 and 6:
Acknowledgments We would like to ac
- Page 7 and 8:
Public Reporting as a Quality Impro
- Page 9 and 10:
Tables Table A. Summary Evidence Ta
- Page 11 and 12:
and using reports and other decisio
- Page 13 and 14:
• Outcomes (specified for each Ke
- Page 15 and 16:
Methods A Technical Expert Panel fo
- Page 17 and 18:
setting), and the strength of the b
- Page 19 and 20:
Table A. Summary evidence table: ef
- Page 21 and 22:
was at the time the included studie
- Page 23 and 24:
6. Hibbard JH, Sofaer S. Best Pract
- Page 25 and 26:
access to essential information and
- Page 27 and 28:
providers, for purposes of this rev
- Page 29 and 30:
information and reduces comprehensi
- Page 31 and 32:
Methods Topic Nomination and Develo
- Page 33 and 34:
Table 1. Public reporting concepts
- Page 35 and 36:
• The public reporting was only a
- Page 37 and 38:
• Key Question 2. Harms included
- Page 39 and 40:
were retained, but they were not as
- Page 41 and 42:
Data Extraction Following full text
- Page 43 and 44:
Data Synthesis We separated studies
- Page 45 and 46:
Results Organization The results of
- Page 47 and 48:
Overview of Effectiveness of Public
- Page 49 and 50:
Access restrictions. It was unclear
- Page 51 and 52:
o The results of two studies sugges
- Page 53 and 54:
Key Question 5 What characteristics
- Page 55 and 56:
Long-term care • Studies that exa
- Page 57 and 58:
Harms (Key Question 2) • Two 52,6
- Page 59 and 60:
eport known as QualityCounts was pr
- Page 61 and 62:
Table 1. Study findings: hospital c
- Page 63 and 64:
o One study found that patients tre
- Page 65 and 66:
condition found declines for CHF (7
- Page 67 and 68:
developed (HCAHPS) and public repor
- Page 69 and 70:
Key Question 6. Context Two studies
- Page 71 and 72:
• Survey responses of hospitals i
- Page 73 and 74:
activity would influence hospital c
- Page 75 and 76:
Lab-Type Experiments The two articl
- Page 77 and 78:
Table 3. Summary of evidence: publi
- Page 79 and 80:
Table 3. Summary of evidence: publi
- Page 81 and 82:
Table 3. Summary of evidence: publi
- Page 83 and 84:
Table 3. Summary of evidence: publi
- Page 85 and 86:
Table 3. Summary of evidence: publi
- Page 87 and 88:
Table 3. Summary of evidence: publi
- Page 89 and 90:
Table 3. Summary of evidence: publi
- Page 91 and 92:
Individual Clinicians and Outpatien
- Page 93 and 94:
public reports influenced the contr
- Page 95 and 96:
New York State to trends in other S
- Page 97 and 98:
One study evaluated use of a Web si
- Page 99 and 100:
Patients. Patient reactions to publ
- Page 101 and 102:
Table 4. Summary of evidence: quali
- Page 103 and 104:
Table 4. Summary of evidence: Quali
- Page 105 and 106:
Health Plans Rating and reporting o
- Page 107 and 108:
The public reporting intervention i
- Page 109 and 110:
that included adjustment for severa
- Page 111 and 112:
Key Question 6. Context Five studie
- Page 113 and 114:
about patient-physician relationshi
- Page 115 and 116:
CAHPS results. Credibility of the r
- Page 117 and 118:
Table 5. Summary of evidence: publi
- Page 119 and 120:
Table 5. Summary of evidence: publi
- Page 121 and 122:
Table 5. Summary of evidence: publi
- Page 123 and 124:
Long-Term Care Services Prior syste
- Page 125 and 126:
o Improvement in one QM (influenza
- Page 127 and 128:
studies that examined change and tr
- Page 129 and 130:
Table 6. Study findings: change in
- Page 131 and 132:
ehospitalizations for these patient
- Page 133 and 134:
improvements in the pain measure we
- Page 135 and 136:
Werner et al. 107 2012 included ext
- Page 137 and 138:
Table 7. Summary of evidence: long-
- Page 139 and 140:
Table 7. Summary of evidence: long-
- Page 141 and 142:
Table 7. Summary of evidence: long-
- Page 143 and 144:
Table 7. Summary of evidence: long-
- Page 145 and 146:
Table 7. Summary of evidence: long-
- Page 147 and 148:
Figure 3. Number of included quanti
- Page 149 and 150:
suggests the possibility that addit
- Page 151 and 152:
Table 8. Summary evidence table: Ef
- Page 153 and 154:
literature sources that we were abl
- Page 155 and 156:
of public reports have a wide range
- Page 157 and 158:
approaches to reducing bias in heal
- Page 159 and 160:
21. Young G. Multistakeholder regio
- Page 161 and 162:
60. Castle NG, Liu D, Engberg J. Th
- Page 163 and 164:
99. Knutson DJ, Kind EA, Fowles JB,
- Page 165 and 166:
141. Schneider EC, Epstein AM. Infl
- Page 167 and 168:
181. Scanlo DP, Chernew M, McLaughl
- Page 169 and 170:
222. Ketelaar NA, Faber MJ, Flottor
- Page 171 and 172:
Appendix A. Literature Search Datab
- Page 173 and 174:
CINAHL EBSCO Plus with Full Text Da
- Page 175 and 176:
EMBASE - Elsevier (1973-present) Da
- Page 177 and 178:
Public Affairs Information Service
- Page 179 and 180:
Full Text Review Include: Based on
- Page 181 and 182:
Appendix C. Included and Excluded S
- Page 183 and 184:
29. Castle NG, Sonon K, Antonova J.
- Page 185 and 186:
58. Gabel JR. When employers choose
- Page 187 and 188:
86. Hibbard JH, Peters E, Dixon A,
- Page 189 and 190:
117. Marshall M, Noble J, Davies H,
- Page 191 and 192:
145. Pettijohn TL, Lawrence ME. The
- Page 193 and 194:
174. Spranca MD, Elliott MN, Shaw R
- Page 195 and 196:
6. NCQA releases HEDIS 2.0 standard
- Page 197 and 198:
40. Pacific Business Group on Healt
- Page 199 and 200:
74. The effect of report cards on M
- Page 201 and 202:
110. MGMA addresses accuracy concer
- Page 203 and 204:
137. Applebaum R, Kunkel S, Wilson
- Page 205 and 206:
165. Barkauskas VH, Pohl JM, Benker
- Page 207 and 208:
193. Bindman AB, Wholey DR, Christi
- Page 209 and 210:
219. Bratzler DW. Development of na
- Page 211 and 212:
247. Caldwell B. Employers use perf
- Page 213 and 214:
275. Centre for R, Dissemination. P
- Page 215 and 216:
301. Chesanow N. Managed care 1999.
- Page 217 and 218:
329. Commonwealth Fund. Commission
- Page 219 and 220:
358. Daly JM, Jogerst GJ. Associati
- Page 221 and 222:
386. DeLiberty RN. Developing a pub
- Page 223 and 224:
412. Doty MM, Koren MJ, Sturla EL,
- Page 225 and 226:
439. Elliott MN, Beckett MK, Kanous
- Page 227 and 228:
467. Feeley TW, Fly HS, Albright H,
- Page 229 and 230:
494. French J. 2003 E.I. Hood Award
- Page 231 and 232:
522. Ginsburg PB, Kemper, N. M. Hea
- Page 233 and 234:
551. Graham JD. Is reporting of qua
- Page 235 and 236:
581. Gruber T, Rudnitsky B. Can we
- Page 237 and 238:
608. Hardingham L. Informed decisio
- Page 239 and 240:
633. Heidenreich PA, Lewis WR, LaBr
- Page 241 and 242:
660. Hodgson ES, Simpson L, Lannon
- Page 243 and 244:
689. Izakovic M. New trends in the
- Page 245 and 246:
718. Kakkar A, Jacobson BC. Interne
- Page 247 and 248:
747. Ketelaar N, Faber M, Flottorp
- Page 249 and 250:
772. . Importance of stratification
- Page 251 and 252:
800. Leonardi MJ, McGory ML, Ko CY.
- Page 253 and 254:
827. Livingston EH. Bariatric surge
- Page 255 and 256:
856. Mantone J. Massachusetts site
- Page 257 and 258:
882. Mazza G, Fazzi B. Five good re
- Page 259 and 260:
907. McKibben L, Horan T, Tokars JI
- Page 261 and 262:
935. Miller R, Lazar J. Public repo
- Page 263 and 264:
963. Morrison K. The road to JCAHO
- Page 265 and 266:
989. National Committee for Quality
- Page 267 and 268:
1017. O’Malley C. Quality measure
- Page 269 and 270:
1045. Peabody J. Why we love qualit
- Page 271 and 272:
1073. Qaseem A, Snow V, Gosfield A,
- Page 273 and 274:
1100. Robinowitz DL, Dudley RA. Pub
- Page 275 and 276:
1129. Roski J, Kim MG. Current effo
- Page 277 and 278:
1156. Sangl JA, Wolf LF. Role of co
- Page 279 and 280:
1183. Schull MJ, Guttmann A, Leaver
- Page 281 and 282:
1212. Shea JA, Guerra CE, Weiner J,
- Page 283 and 284:
1238. Simpson AG, DeGuzman PB, Barb
- Page 285 and 286: 1264. Sofaer S. What information do
- Page 287 and 288: 1292. Stewart DW, Hickson GB, Pechm
- Page 289 and 290: 1320. Tjia J, Field TS, Fischer SH,
- Page 291 and 292: 1346. Van Beek K, Duchemin S, Gersh
- Page 293 and 294: 1374. Weingarten JP, Jr., Fan W, Pe
- Page 295 and 296: 1401. Wiljer D, Bogomilsky S, Catto
- Page 297 and 298: 1426. Zaslavsky AM, Shaul JA, Zabor
- Page 299 and 300: Appendix E. Description of Public R
- Page 301 and 302: Table E1. Descriptive information a
- Page 303 and 304: Table E1. Descriptive information a
- Page 305 and 306: Appendix F. Method for Quality Asse
- Page 307 and 308: the time periods actually prior to
- Page 309 and 310: Application to Public Reporting Thi
- Page 311 and 312: Table G1. Quality assessment criter
- Page 313 and 314: Table G1. Quality assessment criter
- Page 315 and 316: Section A Appendix H. Hospitals: Qu
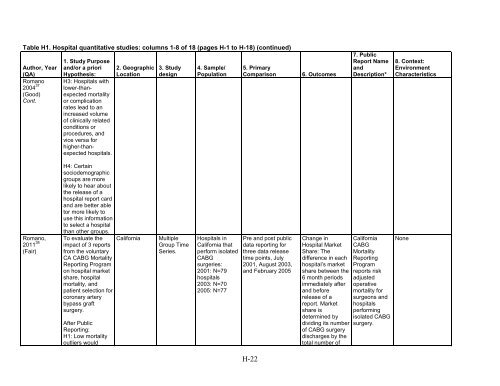
- Page 317 and 318: Table H1. Hospital quantitative stu
- Page 319 and 320: Table H1. Hospital quantitative stu
- Page 321 and 322: Table H1. Hospital quantitative stu
- Page 323 and 324: Table H1. Hospital quantitative stu
- Page 325 and 326: Table H1. Hospital quantitative stu
- Page 327 and 328: Table H1. Hospital quantitative stu
- Page 329 and 330: Table H1. Hospital quantitative stu
- Page 331 and 332: Table H1. Hospital quantitative stu
- Page 333 and 334: Table H1. Hospital quantitative stu
- Page 335: Table H1. Hospital quantitative stu
- Page 339 and 340: Table H1. Hospital quantitative stu
- Page 341 and 342: Table H1. Hospital quantitative stu
- Page 343 and 344: Section B Table H2. C Hospital quan
- Page 345 and 346: Author, Year (QA) Baker 2003 4 (Fai
- Page 347 and 348: Author, Year (QA) Clough 2002 10 (F
- Page 349 and 350: Author, Year (QA) Dranove 2003 13 (
- Page 351 and 352: Author, Year (QA) Foreman 1995 16 (
- Page 353 and 354: Author, Year (QA) Guru 2006 19 (Fai
- Page 355 and 356: Author, Year (QA) Hibbard 2003 24 (
- Page 357 and 358: Author, Year (QA) Jang 2011 28 (Fai
- Page 359 and 360: Author, Year (QA) Mennemeyer 1997 3
- Page 361 and 362: Author, Year (QA) Omoigui 1996 34 (
- Page 363 and 364: Author, Year (QA) Pope 2009 36 (Fai
- Page 365 and 366: Author, Year (QA) 9. Context: Decis
- Page 367 and 368: Author, Year (QA) Vladeck 1988 42 (
- Page 369 and 370: Author, Year (QA) Wuebker, 2008 45
- Page 371 and 372: Table H3. Hospital quantitative stu
- Page 373 and 374: Table H3. Hospital quantitative stu
- Page 375 and 376: Table H3. Hospital quantitative stu
- Page 377 and 378: Table H3. Hospital quantitative stu
- Page 379 and 380: Table H3. Hospital quantitative stu
- Page 381 and 382: Table H3. Hospital quantitative stu
- Page 383 and 384: Table H3. Hospital quantitative stu
- Page 385 and 386: Table H3. Hospital quantitative stu
- Page 387 and 388:
Table H3. Hospital quantitative stu
- Page 389 and 390:
Table H3. Hospital quantitative stu
- Page 391 and 392:
Table H3. Hospital quantitative stu
- Page 393 and 394:
Table I1. Hospital qualitative stud
- Page 395 and 396:
Table I1. Hospital qualitative stud
- Page 397 and 398:
Table I1. Hospital qualitative stud
- Page 399 and 400:
Table I1. Hospital qualitative stud
- Page 401 and 402:
Table I1. Hospital qualitative stud
- Page 403 and 404:
Table I1. Hospital qualitative stud
- Page 405 and 406:
Table I1. Hospital qualitative stud
- Page 407 and 408:
Table I1. Hospital qualitative stud
- Page 409 and 410:
Table I1. Hospital qualitative stud
- Page 411 and 412:
Table I1. Hospital qualitative stud
- Page 413 and 414:
Table I1. Hospital qualitative stud
- Page 415 and 416:
Table I1. Hospital qualitative stud
- Page 417 and 418:
Table I1. Hospital qualitative stud
- Page 419 and 420:
Table I1. Hospital qualitative stud
- Page 421 and 422:
Table I1. Hospital qualitative stud
- Page 423 and 424:
Table I1. Hospital qualitative stud
- Page 425 and 426:
Table I1. Hospital qualitative stud
- Page 427 and 428:
Section B Table I2. Hospital qualit
- Page 429 and 430:
Author, Year 10. KQ3:Results 11. KQ
- Page 431 and 432:
Author, Year 10. KQ3:Results 11. KQ
- Page 433 and 434:
Author, Year 10. KQ3:Results design
- Page 435 and 436:
Author, Year 10. KQ3:Results 11. KQ
- Page 437 and 438:
Author, Year 10. KQ3:Results 11. KQ
- Page 439 and 440:
Author, Year 10. KQ3:Results 11. KQ
- Page 441 and 442:
Author, Year 10. KQ3:Results 11. KQ
- Page 443 and 444:
Author, Year 10. KQ3:Results 11. KQ
- Page 445 and 446:
Author, Year 10. KQ3:Results 11. KQ
- Page 447 and 448:
Author, Year 10. KQ3:Results 11. KQ
- Page 449 and 450:
Author, Year 10. KQ3:Results 11. KQ
- Page 451 and 452:
Author, Year 10. KQ3:Results 11. KQ
- Page 453 and 454:
Author, Year 10. KQ3:Results 11. KQ
- Page 455 and 456:
Author, Year 10. KQ3:Results 11. KQ
- Page 457 and 458:
Author, 15. Funder of Research/ Yea
- Page 459 and 460:
Author, 15. Funder of Research/ Yea
- Page 461 and 462:
Author, Year 10. KQ3:Results 11. KQ
- Page 463 and 464:
Regarding the least useful aspects,
- Page 465 and 466:
Author, 15. Funder of Research/ Yea
- Page 467 and 468:
Author, Year 10. KQ3:Results 11. KQ
- Page 469 and 470:
Author, Year 10. KQ3:Results 11. KQ
- Page 471 and 472:
Author, Year 10. KQ3:Results 11. KQ
- Page 473 and 474:
Author, Year 10. KQ3:Results 11. KQ
- Page 475 and 476:
Author, Year 10. KQ3:Results 11. KQ
- Page 477 and 478:
Author, Year 10. KQ3:Results 11. KQ
- Page 479 and 480:
Section A Appendix J. Individual Pr
- Page 481 and 482:
Author Year (QA) Hannan 1994 21 (Go
- Page 483 and 484:
Author Year (QA) Mukamel 1998 33 (F
- Page 485 and 486:
Author Year (QA) Mukamel 2002 49 (F
- Page 487 and 488:
Author Year (QA) Werner 53 2005 (Go
- Page 489 and 490:
Author Year (QA) Glance 2008 48 (Fa
- Page 491 and 492:
Author Year (QA) Hannan 1994 21 (Go
- Page 493 and 494:
Author Year (QA) Results: KQ1: (Hea
- Page 495 and 496:
Author Year (QA) Mukamel 2000 50 (F
- Page 497 and 498:
Author Year (QA) Results: KQ1: (Hea
- Page 499 and 500:
Author Year (QA) Ranganathan 2009 5
- Page 501 and 502:
Author Year (QA) Results: KQ1: (Hea
- Page 503 and 504:
Author Year (QA) Werner 2005 53 (Go
- Page 505 and 506:
Author Year (QA) Results: KQ1: (Hea
- Page 507 and 508:
Author Year Barr 2008 144 1. Study
- Page 509 and 510:
Author Year Casalino 2007 146 1. St
- Page 511 and 512:
Author Year Fanjiang 2007 150 1. St
- Page 513 and 514:
Author Year Friedber g 2010 151 1.
- Page 515 and 516:
Author Year 1. Study Purpose and/or
- Page 517 and 518:
Author Year Longo 2003 119 1. Study
- Page 519 and 520:
Author Year Marshall 2006 154 Mayth
- Page 521 and 522:
Author Year 1. Study Purpose and/or
- Page 523 and 524:
Author Year Schneid er 1996 138 Con
- Page 525 and 526:
Author Year Schultz 2001 158 Stein
- Page 527 and 528:
Author Year QA Beaulieu 2002 56 Fai
- Page 529 and 530:
Author Year QA Chernew 2004 58 Fair
- Page 531 and 532:
Author Year QA Farley 2002 62 Good
- Page 533 and 534:
Author Year QA Hendricks 2009 66 Po
- Page 535 and 536:
Author Year QA 1. Study Purpose and
- Page 537 and 538:
Author Year QA 1. Study Purpose and
- Page 539 and 540:
Author Year QA 1. Study Purpose and
- Page 541 and 542:
Author Year QA Beaulieu 2002 56 Fai
- Page 543 and 544:
Author Year QA Chernew 2004 58 Fair
- Page 545 and 546:
Author Year QA 11. Results: KQ1: (H
- Page 547 and 548:
Author Year QA Farely 2002 62 Good
- Page 549 and 550:
Author Year QA Fowles 2000 63 Good
- Page 551 and 552:
Author Year QA Hendricks 2009 66 Po
- Page 553 and 554:
Author Year QA Hendricks 2009 66 Po
- Page 555 and 556:
Author Year QA Jung 2010 68 Good Kn
- Page 557 and 558:
Author Year QA 11. Results: KQ1: (H
- Page 559 and 560:
Author Year QA Pham 2002 73 Good 11
- Page 561 and 562:
Author Year QA Tae-Seale 2004 76 Fa
- Page 563 and 564:
Appendix M. Health Plans: Qualitati
- Page 565 and 566:
Author Year Farley-Short 2002 162 1
- Page 567 and 568:
Author Year Gabel 1998 163 1. Study
- Page 569 and 570:
Author Year Gibbs 1996 164 1. Study
- Page 571 and 572:
Author Year 1. Study Purpose 2. Geo
- Page 573 and 574:
Author Year Harris- Koejetin 2000 1
- Page 575 and 576:
Author Year Hibbard 1997 171 1. Stu
- Page 577 and 578:
Author Year Hibbard 2002 172 1. Stu
- Page 579 and 580:
Author Year Hibbard 2001 175 1. Stu
- Page 581 and 582:
Author Year Hibbard 1997 177 1. Stu
- Page 583 and 584:
Author Year Hibbard 2001 178 Hibbar
- Page 585 and 586:
Author Year 1. Study Purpose 2. Geo
- Page 587 and 588:
Author Year Paulsbo 2007 183 Peters
- Page 589 and 590:
Author Year Rosenthal 2007 186 1. S
- Page 591 and 592:
Author Year Scanlon 2001 188 1. Stu
- Page 593 and 594:
Author Year Spranca 2000 190 1. Stu
- Page 595 and 596:
Author Year Teleki 2007 192 1. Stud
- Page 597 and 598:
Author Year Uhrig 2006 194 1. Study
- Page 599 and 600:
Section A Appendix N. Long-Term Car
- Page 601 and 602:
Author Year Jung 2010 85 Konetzka 2
- Page 603 and 604:
Author Year Werner 2009a 92 Werner
- Page 605 and 606:
Author Year Zinn 2010 99 1. Study P
- Page 607 and 608:
Author Year Castle 2007 79 Cont. 11
- Page 609 and 610:
Author Year Castle 2010 81 11. Resu
- Page 611 and 612:
Author Year Jung 2010 85 11. Result
- Page 613 and 614:
Author Year Mukamel 2008 86 Mukamel
- Page 615 and 616:
Author Year Park 2011 b 90 11. Resu
- Page 617 and 618:
Author Year Werner 2009 b 93 11. Re
- Page 619 and 620:
Author Year Werner 2010 94 Werner 2
- Page 621 and 622:
Author Year Zinn 2005 97 11. Result
- Page 623 and 624:
Author Year Zinn 2010 99 11. Result
- Page 625 and 626:
Appendix O. Long-Term Care: Qualita
- Page 627 and 628:
Author Year Castle 2005 197 1. Stud
- Page 629 and 630:
Author Year Gerteis 2007 198 1. Stu
- Page 631 and 632:
Author Year 1. Study Purpose 2. Geo
- Page 633 and 634:
Author Year 1. Study Purpose 2. Geo
- Page 635 and 636:
References 1. AHRQ. Methods Guide f
- Page 637 and 638:
36. Pope DG. Reacting to rankings:
- Page 639 and 640:
77. Wedig GJ, Tai-Seale M. The effe
- Page 641 and 642:
118. Laschober M, Maxfield M, Felt-
- Page 643 and 644:
157. Pettijohn TL, Lawrence ME. The
- Page 645:
198. Gerteis M, Gerteis JS, Newman