

Download complete issue - IndexUniverse.com
Download complete issue - IndexUniverse.com
Download complete issue - IndexUniverse.com

You also want an ePaper? Increase the reach of your titles
YUMPU automatically turns print PDFs into web optimized ePapers that Google loves.
Exchange-traded products span a wide range of offerings,<br />
including broad style, sector, industry, country,<br />
regional and cross-asset benchmarks. A key reason<br />
for their popularity is convenience. Because exchangetraded<br />
products trade and settle like a stock, there is no<br />
additional infrastructure or documentation required. The<br />
most popular exchange-traded product is the exchangetraded<br />
fund. For the remainder of this piece, for readability<br />
and familiarity, we use the term “ETF” to mean exchangetraded<br />
fund and to include other exchange-traded products<br />
such as exchange-traded notes (ETNs).<br />
Since the credit crisis, with cross-asset correlations<br />
rising, there has been increased demand for investments<br />
with broader access. As a result, hedge funds and<br />
traditional institutional investors increasingly are using<br />
ETFs. Common applications include allocating assets,<br />
top-down investing, cash flow management, hedging<br />
either broadly or tactically within sectors and executing<br />
relative value strategies; for example, trading a stock<br />
versus its own sector. ETFs offer flexibility, and given<br />
that the products trade like ordinary equities, some<br />
institutions that are restricted from using traditional<br />
derivatives are able to use ETFs.<br />
Along with growth in the ETF market, there has been<br />
a similar rise in the use of options on exchange-traded<br />
products. The goal of this report is to examine the size,<br />
growth and breadth of the ETF options market and then<br />
provide examples of options strategies this market now<br />
allows. The analysis that follows uses a universe of ETF<br />
options whose underlying ETF country of domicile is the<br />
United States and that which is traded in U.S. dollars. We<br />
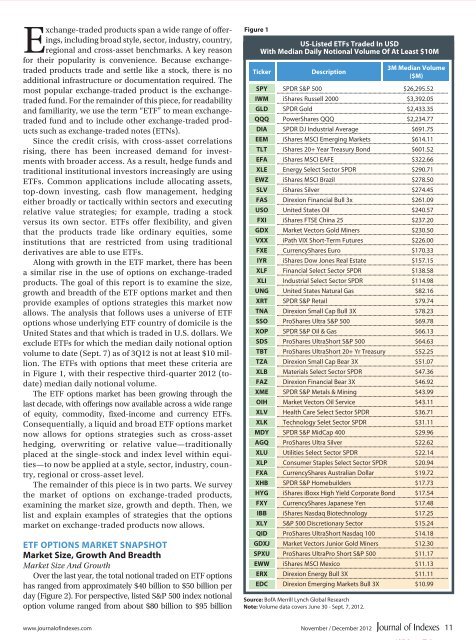
exclude ETFs for which the median daily notional option<br />
volume to date (Sept. 7) as of 3Q12 is not at least $10 million.<br />
The ETFs with options that meet these criteria are<br />
in Figure 1, with their respective third-quarter 2012 (todate)<br />
median daily notional volume.<br />
The ETF options market has been growing through the<br />
last decade, with offerings now available across a wide range<br />
of equity, <strong>com</strong>modity, fixed-in<strong>com</strong>e and currency ETFs.<br />
Consequentially, a liquid and broad ETF options market<br />
now allows for options strategies such as cross-asset<br />
hedging, overwriting or relative value—traditionally<br />
placed at the single-stock and index level within equities—to<br />
now be applied at a style, sector, industry, country,<br />
regional or cross-asset level.<br />
The remainder of this piece is in two parts. We survey<br />
the market of options on exchange-traded products,<br />
examining the market size, growth and depth. Then, we<br />
list and explain examples of strategies that the options<br />
market on exchange-traded products now allows.<br />
ETF OPTIONS MARKET SNAPSHOT<br />
Market Size, Growth And Breadth<br />
Market Size And Growth<br />
Over the last year, the total notional traded on ETF options<br />
has ranged from approximately $40 billion to $50 billion per<br />
day (Figure 2). For perspective, listed S&P 500 index notional<br />
option volume ranged from about $80 billion to $95 billion<br />
Figure 1<br />
US-Listed ETFs Traded In USD<br />
With Median Daily Notional Volume Of At Least $10M<br />
Ticker<br />
Description<br />
3M Median Volume<br />
($M)<br />
SPY SPDR S&P 500 $26,295.52<br />
IWM iShares Russell 2000 $3,392.05<br />
GLD SPDR Gold $2,433.35<br />
QQQ PowerShares QQQ $2,234.77<br />
DIA SPDR DJ Industrial Average $691.75<br />
EEM iShares MSCI Emerging Markets $614.11<br />
TLT iShares 20+ Year Treasury Bond $601.52<br />
EFA iShares MSCI EAFE $322.66<br />
XLE Energy Select Sector SPDR $290.71<br />
EWZ iShares MSCI Brazil $278.50<br />
SLV iShares Silver $274.45<br />
FAS Direxion Financial Bull 3x $261.09<br />
USO United States Oil $240.57<br />
FXI iShares FTSE China 25 $237.20<br />
GDX Market Vectors Gold Miners $230.50<br />
VXX iPath VIX Short-Term Futures $226.00<br />
FXE CurrencyShares Euro $170.33<br />
IYR iShares Dow Jones Real Estate $157.15<br />
XLF Financial Select Sector SPDR $138.58<br />
XLI Industrial Select Sector SPDR $114.98<br />
UNG United States Natural Gas $82.16<br />
XRT SPDR S&P Retail $79.74<br />
TNA Direxion Small Cap Bull 3X $78.23<br />
SSO ProShares Ultra S&P 500 $69.78<br />
XOP SPDR S&P Oil & Gas $66.13<br />
SDS ProShares UltraShort S&P 500 $64.63<br />
TBT ProShares UltraShort 20+ Yr Treasury $52.25<br />
TZA Direxion Small Cap Bear 3X $51.07<br />
XLB Materials Select Sector SPDR $47.36<br />
FAZ Direxion Financial Bear 3X $46.92<br />
XME SPDR S&P Metals & Mining $43.99<br />
OIH Market Vectors Oil Service $43.11<br />
XLV Health Care Select Sector SPDR $36.71<br />
XLK Technology Selet Sector SPDR $31.11<br />
MDY SPDR S&P MidCap 400 $29.96<br />
AGQ ProShares Ultra Silver $22.62<br />
XLU Utilities Select Sector SPDR $22.14<br />
XLP Consumer Staples Select Sector SPDR $20.94<br />
FXA CurrencyShares Australian Dollar $19.72<br />
XHB SPDR S&P Homebuilders $17.73<br />
HYG iShares iBoxx High Yield Corporate Bond $17.54<br />
FXY CurrencyShares Japanese Yen $17.48<br />
IBB iShares Nasdaq Biotechnology $17.25<br />
XLY S&P 500 Discretionary Sector $15.24<br />
QID ProShares UltraShort Nasdaq 100 $14.18<br />
GDXJ Market Vectors Junior Gold Miners $12.30<br />
SPXU ProShares UltraPro Short S&P 500 $11.17<br />
EWW iShares MSCI Mexico $11.13<br />
ERX Direxion Energy Bull 3X $11.11<br />
EDC Direxion Emerging Markets Bull 3X $10.99<br />
Source: BofA Merrill Lynch Global Research<br />
Note: Volume data covers June 30 - Sept. 7, 2012.<br />
www.journalofindexes.<strong>com</strong> November / December 2012<br />
11


