

Download complete issue - IndexUniverse.com
Download complete issue - IndexUniverse.com
Download complete issue - IndexUniverse.com

Create successful ePaper yourself
Turn your PDF publications into a flip-book with our unique Google optimized e-Paper software.
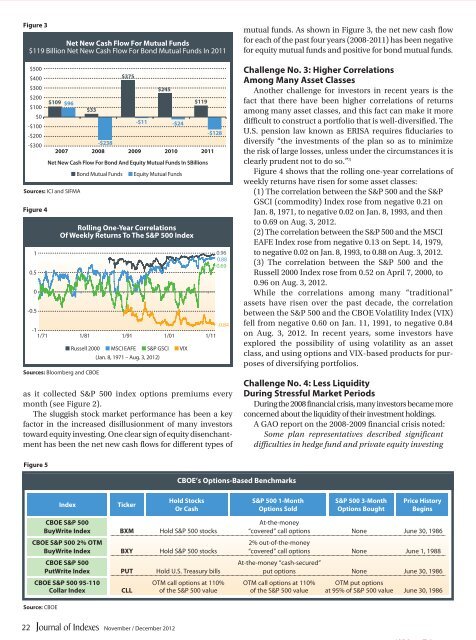
Figure 3<br />
Net New Cash Flow For Mutual Funds<br />
$119 Billion Net New Cash Flow For Bond Mutual Funds In 2011<br />
$500<br />
$400<br />
$300<br />
$200<br />
$100<br />
$0<br />
-$100<br />
-$200<br />
-$300<br />
$109 $96<br />
-$238<br />
2007 2008 2009 2010 2011<br />
Net New Cash Flow For Bond And Equity Mutual Funds In $Billions<br />
Sources: ICI and SIFMA<br />
Figure 4<br />
1<br />
0.5<br />
0<br />
-0.5<br />
-1<br />
1/71<br />
$33<br />
■ Bond Mutual Funds<br />
$375<br />
$245<br />
-$11 -$24<br />
■ Equity Mutual Funds<br />
Rolling One-Year Correlations<br />
Of Weekly Returns To The S&P 500 Index<br />
Sources: Bloomberg and CBOE<br />
■ Russell 2000 ■ MSCI EAFE ■ S&P GSCI ■ VIX<br />
(Jan. 8, 1971 – Aug. 3, 2012)<br />
$119<br />
-$128<br />
1/81 1/91 1/01 1/11<br />
0.96<br />
0.88<br />
0.69<br />
-0.84<br />
as it collected S&P 500 index options premiums every<br />
month (see Figure 2).<br />
The sluggish stock market performance has been a key<br />
factor in the increased disillusionment of many investors<br />
toward equity investing. One clear sign of equity disenchantment<br />
has been the net new cash flows for different types of<br />
mutual funds. As shown in Figure 3, the net new cash flow<br />
for each of the past four years (2008-2011) has been negative<br />
for equity mutual funds and positive for bond mutual funds.<br />
Challenge No. 3: Higher Correlations<br />
Among Many Asset Classes<br />
Another challenge for investors in recent years is the<br />
fact that there have been higher correlations of returns<br />
among many asset classes, and this fact can make it more<br />
difficult to construct a portfolio that is well-diversified. The<br />
U.S. pension law known as ERISA requires fiduciaries to<br />
diversify “the investments of the plan so as to minimize<br />
the risk of large losses, unless under the circumstances it is<br />
clearly prudent not to do so.” 3<br />
Figure 4 shows that the rolling one-year correlations of<br />
weekly returns have risen for some asset classes:<br />
(1) The correlation between the S&P 500 and the S&P<br />
GSCI (<strong>com</strong>modity) Index rose from negative 0.21 on<br />
Jan. 8, 1971, to negative 0.02 on Jan. 8, 1993, and then<br />
to 0.69 on Aug. 3, 2012.<br />
(2) The correlation between the S&P 500 and the MSCI<br />
EAFE Index rose from negative 0.13 on Sept. 14, 1979,<br />
to negative 0.02 on Jan. 8, 1993, to 0.88 on Aug. 3, 2012.<br />
(3) The correlation between the S&P 500 and the<br />
Russell 2000 Index rose from 0.52 on April 7, 2000, to<br />
0.96 on Aug. 3, 2012.<br />
While the correlations among many “traditional”<br />
assets have risen over the past decade, the correlation<br />
between the S&P 500 and the CBOE Volatility Index (VIX)<br />
fell from negative 0.60 on Jan. 11, 1991, to negative 0.84<br />
on Aug. 3, 2012. In recent years, some investors have<br />
explored the possibility of using volatility as an asset<br />
class, and using options and VIX-based products for purposes<br />
of diversifying portfolios.<br />
Challenge No. 4: Less Liquidity<br />
During Stressful Market Periods<br />
During the 2008 financial crisis, many investors became more<br />
concerned about the liquidity of their investment holdings.<br />
A GAO report on the 2008-2009 financial crisis noted:<br />
Some plan representatives described significant<br />
difficulties in hedge fund and private equity investing<br />
Figure 5<br />
CBOE’s Options-Based Benchmarks<br />
Index<br />
Ticker<br />
Hold Stocks<br />
Or Cash<br />
S&P 500 1-Month<br />
Options Sold<br />
S&P 500 3-Month<br />
Options Bought<br />
Price History<br />
Begins<br />
CBOE S&P 500<br />
At-the-money<br />
BuyWrite Index BXM Hold S&P 500 stocks “covered” call options None June 30, 1986<br />
CBOE S&P 500 2% OTM<br />
2% out-of-the-money<br />
BuyWrite Index BXY Hold S&P 500 stocks “covered” call options None June 1, 1988<br />
CBOE S&P 500<br />
At-the-money “cash-secured”<br />
PutWrite Index PUT Hold U.S. Treasury bills put options None June 30, 1986<br />
CBOE S&P 500 95-110 OTM call options at 110% OTM call options at 110% OTM put options<br />
Collar Index CLL of the S&P 500 value of the S&P 500 value at 95% of S&P 500 value June 30, 1986<br />
Source: CBOE<br />
22<br />
November / December 2012


