

Download complete issue - IndexUniverse.com
Download complete issue - IndexUniverse.com
Download complete issue - IndexUniverse.com

You also want an ePaper? Increase the reach of your titles
YUMPU automatically turns print PDFs into web optimized ePapers that Google loves.
500 BuyWrite Index (BXM)—was announced in 2002.<br />
The BXM Index assumes that slightly out-of-the-money<br />
S&P 500 options are written on the third Friday of every<br />
month, and the average gross monthly yield for the BXM<br />
Index (using the premium received as a percentage of<br />
the underlying) has been about 1.8 percent. Figure 12<br />
shows the rolling 12-month gross premiums for the BXM<br />
Index, and the rolling 12-month net returns for both the<br />
BXM Index and S&P 500 Index. In Figure 12, note that<br />
the BXM net return has been pretty close to the BXM<br />
gross premiums in times of steadily rising stock markets.<br />
However, in years in which the S&P 500 has experienced<br />
big drops (e.g., 2001 and 2008), the BXM net return was<br />
generally above that of the S&P 500, and far below the<br />
BXM gross premiums as a percentage of the underlying.<br />
Managing Of Left-Tail Risk And ‘Black Swan’ Events<br />
After witnessing two big declines in stock index values<br />
since the year 2000 (see Figure 2), many investors in<br />
recent years have heightened concerns about left-tail risk<br />
and catastrophic “Black Swan” events that could harm<br />
Figure 11<br />
Diference in Volatility Points<br />
Figure 12<br />
80%<br />
60%<br />
40%<br />
20%<br />
0%<br />
-20%<br />
-40%<br />
10<br />
5<br />
0<br />
-5<br />
-10<br />
Implied Volatility (VIX) Minus Subsequent<br />
SPX Realized Volatility<br />
(SPX Options Usually Have Been Richly Priced)<br />
-15<br />
6/90 6/93 6/96 6/99 6/02 6/05 6/08 6/11<br />
(June 8, 1990 - July 20, 2012) Rolling 6-month average of the spread between<br />
end-of-week VIX and the subsequent 30-day SPX realized volatility<br />
Sources: Bloomberg and CBOE<br />
Rolling 12-Month Gross Premiums<br />
And Net Returns<br />
-60%<br />
6/89 6/92 6/95 6/98 6/01 6/04 6/07 6/10<br />
BXM Gross Premiums ■ BXM Net Return ■ S&P 500 Net Return<br />
(June 1989 – July 2012)<br />
Sources: Bloomberg and CBOE<br />
Note: BXM gross premiums are received every month and are expressed as annualized<br />
% of the underlying S&P 500 Index. Net returns are for total return indexes.<br />
Figure 13<br />
160<br />
120<br />
80<br />
40<br />
0<br />
-24% to<br />
-20%<br />
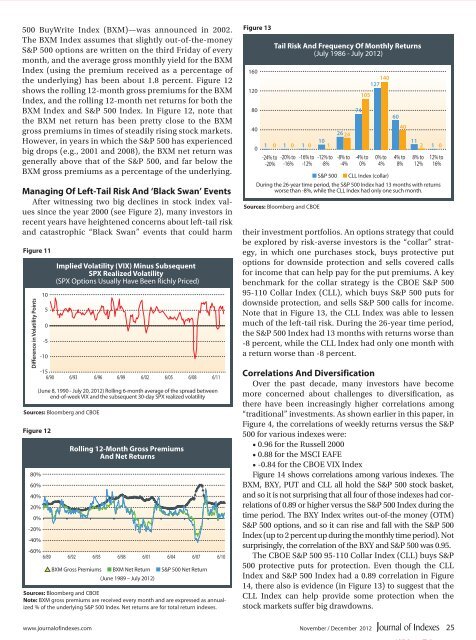
Tail Risk And Frequency Of Monthly Returns<br />
(July 1986 - July 2012)<br />
40<br />
2624<br />
10<br />
11<br />
1 0 1 0 1 0 1<br />
2 1 0<br />
-20% to<br />
-16%<br />
-16% to<br />
-12%<br />
-12% to<br />
-8%<br />
■ S&P 500<br />
-8% to<br />
-4%<br />
105<br />
-4% to<br />
0%<br />
140<br />
127<br />
0% to<br />
4%<br />
■ CLL Index (collar)<br />
4% to<br />
8%<br />
8% to<br />
12%<br />
12% to<br />
16%<br />
During the 26-year time period, the S&P 500 Index had 13 months with returns<br />
worse than -8%, while the CLL Index had only one such month.<br />
Sources: Bloomberg and CBOE<br />
their investment portfolios. An options strategy that could<br />
be explored by risk-averse investors is the “collar” strategy,<br />
in which one purchases stock, buys protective put<br />
options for downside protection and sells covered calls<br />
for in<strong>com</strong>e that can help pay for the put premiums. A key<br />
benchmark for the collar strategy is the CBOE S&P 500<br />
95-110 Collar Index (CLL), which buys S&P 500 puts for<br />
downside protection, and sells S&P 500 calls for in<strong>com</strong>e.<br />
Note that in Figure 13, the CLL Index was able to lessen<br />
much of the left-tail risk. During the 26-year time period,<br />
the S&P 500 Index had 13 months with returns worse than<br />
-8 percent, while the CLL Index had only one month with<br />
a return worse than -8 percent.<br />
Correlations And Diversification<br />
Over the past decade, many investors have be<strong>com</strong>e<br />
more concerned about challenges to diversification, as<br />
there have been increasingly higher correlations among<br />
“traditional” investments. As shown earlier in this paper, in<br />
Figure 4, the correlations of weekly returns versus the S&P<br />
500 for various indexes were:<br />
• 0.96 for the Russell 2000<br />
• 0.88 for the MSCI EAFE<br />
• -0.84 for the CBOE VIX Index<br />
Figure 14 shows correlations among various indexes. The<br />
BXM, BXY, PUT and CLL all hold the S&P 500 stock basket,<br />
and so it is not surprising that all four of those indexes had correlations<br />
of 0.89 or higher versus the S&P 500 Index during the<br />
time period. The BXY Index writes out-of-the money (OTM)<br />
S&P 500 options, and so it can rise and fall with the S&P 500<br />
Index (up to 2 percent up during the monthly time period). Not<br />
surprisingly, the correlation of the BXY and S&P 500 was 0.95.<br />
The CBOE S&P 500 95-110 Collar Index (CLL) buys S&P<br />
500 protective puts for protection. Even though the CLL<br />
Index and S&P 500 Index had a 0.89 correlation in Figure<br />
14, there also is evidence (in Figure 13) to suggest that the<br />
CLL Index can help provide some protection when the<br />
stock markets suffer big drawdowns.<br />
74<br />
60<br />
www.journalofindexes.<strong>com</strong><br />
November / December 2012<br />
25


