

Download complete issue - IndexUniverse.com
Download complete issue - IndexUniverse.com
Download complete issue - IndexUniverse.com

Create successful ePaper yourself
Turn your PDF publications into a flip-book with our unique Google optimized e-Paper software.
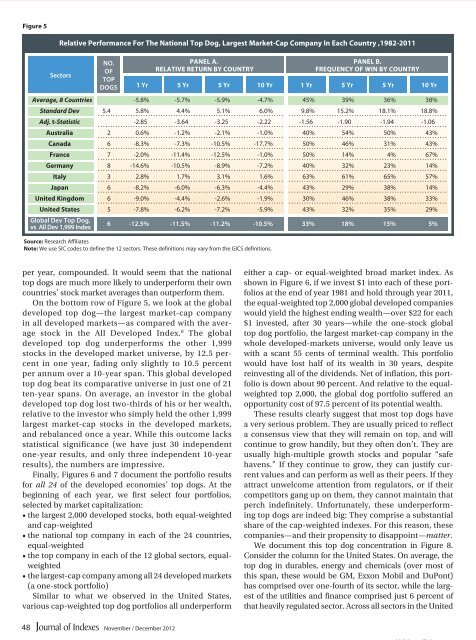
Figure 5<br />
Relative Performance For The National Top Dog, Largest Market-Cap Company In Each Country ,1982-2011<br />
sectors<br />
no.<br />
of<br />
top<br />
dogs<br />
PaNEL a.<br />
RELaTIvE RETuRN BY CouNTRY<br />
1 Yr 5 Yr 5 Yr 10 Yr 1 Yr<br />
5 Yr<br />
5 Yr<br />
10 Yr<br />
Source: Research Affiliates<br />
Note: We use SIC codes to define the 12 sectors. These definitions may vary from the GICS definitions.<br />
PaNEL B.<br />
FREQuENCY oF WIN BY CouNTRY<br />
Average, 8 Countries -5.8% -5.7% -5.9% -4.7% 45% 39% 36% 38%<br />
Standard Dev 5.4 5.8% 4.4% 5.1% 6.0% 9.8% 15.2% 18.1% 18.8%<br />
Adj. t-Statistic -2.85 -3.64 -3.25 -2.22 -1.56 -1.90 -1.94 -1.06<br />
australia 2 0.6% -1.2% -2.1% -1.0% 40% 54% 50% 43%<br />
Canada 6 -8.3% -7.3% -10.5% -17.7% 50% 46% 31% 43%<br />
France 7 -2.0% -11.4% -12.5% -1.0% 50% 14% 4% 67%<br />
Germany 8 -14.6% -10.5% -8.9% -7.2% 40% 32% 23% 14%<br />
Italy 3 2.8% 1.7% 3.1% 1.6% 63% 61% 65% 57%<br />
Japan 6 -8.2% -6.0% -6.3% -4.4% 43% 29% 38% 14%<br />
united Kingdom 6 -9.0% -4.4% -2.6% -1.9% 30% 46% 38% 33%<br />
united States 5 -7.8% -6.2% -7.2% -5.9% 43% 32% 35% 29%<br />
global dev top dog,<br />
vs All dev 1,999 Index<br />
6 -12.5% -11.5% -11.2% -10.5% 33% 18% 15% 5%<br />
per year, <strong>com</strong>pounded. It would seem that the national<br />
top dogs are much more likely to underperform their own<br />
countries’ stock market averages than outperform them.<br />
On the bottom row of Figure 5, we look at the global<br />
developed top dog—the largest market-cap <strong>com</strong>pany<br />
in all developed markets—as <strong>com</strong>pared with the average<br />
stock in the All Developed Index. 8 The global<br />
developed top dog underperforms the other 1,999<br />
stocks in the developed market universe, by 12.5 percent<br />
in one year, fading only slightly to 10.5 percent<br />
per annum over a 10-year span. This global developed<br />
top dog beat its <strong>com</strong>parative universe in just one of 21<br />
ten-year spans. On average, an investor in the global<br />
developed top dog lost two-thirds of his or her wealth,<br />
relative to the investor who simply held the other 1,999<br />
largest market-cap stocks in the developed markets,<br />
and rebalanced once a year. While this out<strong>com</strong>e lacks<br />
statistical significance (we have just 30 independent<br />
one-year results, and only three independent 10-year<br />
results), the numbers are impressive.<br />
Finally, Figures 6 and 7 document the portfolio results<br />
for all 24 of the developed economies’ top dogs. At the<br />
beginning of each year, we first select four portfolios,<br />
selected by market capitalization:<br />
• the largest 2,000 developed stocks, both equal-weighted<br />
and cap-weighted<br />
• the national top <strong>com</strong>pany in each of the 24 countries,<br />
equal-weighted<br />
• the top <strong>com</strong>pany in each of the 12 global sectors, equalweighted<br />
• the largest-cap <strong>com</strong>pany among all 24 developed markets<br />
(a one-stock portfolio)<br />
Similar to what we observed in the United States,<br />
various cap-weighted top dog portfolios all underperform<br />
either a cap- or equal-weighted broad market index. As<br />
shown in Figure 6, if we invest $1 into each of these portfolios<br />
at the end of year 1981 and hold through year 2011,<br />
the equal-weighted top 2,000 global developed <strong>com</strong>panies<br />
would yield the highest ending wealth—over $22 for each<br />
$1 invested, after 30 years—while the one-stock global<br />
top dog portfolio, the largest market-cap <strong>com</strong>pany in the<br />
whole developed-markets universe, would only leave us<br />
with a scant 55 cents of terminal wealth. This portfolio<br />
would have lost half of its wealth in 30 years, despite<br />
reinvesting all of the dividends. Net of inflation, this portfolio<br />
is down about 90 percent. And relative to the equalweighted<br />
top 2,000, the global dog portfolio suffered an<br />
opportunity cost of 97.5 percent of its potential wealth.<br />
These results clearly suggest that most top dogs have<br />
a very serious problem. They are usually priced to reflect<br />
a consensus view that they will remain on top, and will<br />
continue to grow handily, but they often don’t. They are<br />
usually high-multiple growth stocks and popular “safe<br />
havens.” If they continue to grow, they can justify current<br />
values and can perform as well as their peers. If they<br />
attract unwel<strong>com</strong>e attention from regulators, or if their<br />
<strong>com</strong>petitors gang up on them, they cannot maintain that<br />
perch indefinitely. Unfortunately, these underperforming<br />
top dogs are indeed big: They <strong>com</strong>prise a substantial<br />
share of the cap-weighted indexes. For this reason, these<br />
<strong>com</strong>panies—and their propensity to disappoint—matter.<br />
We document this top dog concentration in Figure 8.<br />
Consider the column for the United States. On average, the<br />
top dog in durables, energy and chemicals (over most of<br />
this span, these would be GM, Exxon Mobil and DuPont)<br />
has <strong>com</strong>prised over one-fourth of its sector, while the largest<br />
of the utilities and finance <strong>com</strong>prised just 6 percent of<br />
that heavily regulated sector. Across all sectors in the United<br />
48<br />
November / December 2012


