

Download complete issue - IndexUniverse.com
Download complete issue - IndexUniverse.com
Download complete issue - IndexUniverse.com

You also want an ePaper? Increase the reach of your titles
YUMPU automatically turns print PDFs into web optimized ePapers that Google loves.
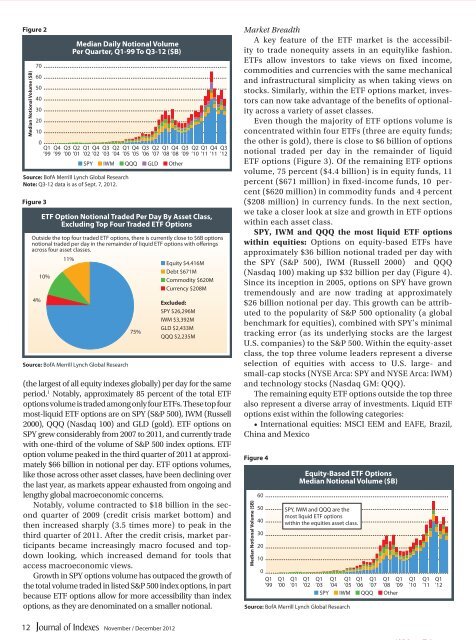
Figure 2<br />
Median Notional Volume ($B)<br />
70<br />
60<br />
50<br />
40<br />
30<br />
20<br />
10<br />
Source: BofA Merrill Lynch Global Research<br />
Note: Q3-12 data is as of Sept. 7, 2012.<br />
Figure 3<br />
4%<br />
Median Daily Notional Volume<br />
Per Quarter, Q1-99 To Q3-12 ($B)<br />
0<br />
Q1<br />
’99 ’99 Q4<br />
’00 Q3<br />
’01 Q2<br />
’02 Q1<br />
’02 Q4<br />
’03 Q3<br />
’04 Q2<br />
’05 Q1<br />
’05 Q4<br />
’06 Q3<br />
’07 Q2<br />
’08 Q1<br />
’08 Q4<br />
’09 Q3<br />
’10 Q2<br />
’11 Q1<br />
’11 Q4<br />
’12<br />
Q3<br />
■ SPY ■ IWM<br />
Source: BofA Merrill Lynch Global Research<br />
■ QQQ ■ GLD ■ Other<br />
ETF Option Notional Traded Per Day By Asset Class,<br />
Excluding Top Four Traded ETF Options<br />
Outside the top four traded ETF options, there is currently close to $6B options<br />
notional traded per day in the remainder of liquid ETF options with oferings<br />
across four asset classes.<br />
10%<br />
11%<br />
75%<br />
■ Equity $4.416M<br />
■ Debt $671M<br />
■ Commodity $620M<br />
■ Currency $208M<br />
Excluded:<br />
SPY $26,296M<br />
IWM $3,392M<br />
GLD $2,433M<br />
QQQ $2,235M<br />
(the largest of all equity indexes globally) per day for the same<br />
period. 1 Notably, approximately 85 percent of the total ETF<br />
options volume is traded among only four ETFs. These top four<br />
most-liquid ETF options are on SPY (S&P 500), IWM (Russell<br />
2000), QQQ (Nasdaq 100) and GLD (gold). ETF options on<br />
SPY grew considerably from 2007 to 2011, and currently trade<br />
with one-third of the volume of S&P 500 index options. ETF<br />
option volume peaked in the third quarter of 2011 at approximately<br />
$66 billion in notional per day. ETF options volumes,<br />
like those across other asset classes, have been declining over<br />
the last year, as markets appear exhausted from ongoing and<br />
lengthy global macroeconomic concerns.<br />
Notably, volume contracted to $18 billion in the second<br />
quarter of 2009 (credit crisis market bottom) and<br />
then increased sharply (3.5 times more) to peak in the<br />
third quarter of 2011. After the credit crisis, market participants<br />
became increasingly macro focused and topdown<br />
looking, which increased demand for tools that<br />
access macroeconomic views.<br />
Growth in SPY options volume has outpaced the growth of<br />
the total volume traded in listed S&P 500 index options, in part<br />
because ETF options allow for more accessibility than index<br />
options, as they are denominated on a smaller notional.<br />
Market Breadth<br />
A key feature of the ETF market is the accessibility<br />
to trade nonequity assets in an equitylike fashion.<br />
ETFs allow investors to take views on fixed in<strong>com</strong>e,<br />
<strong>com</strong>modities and currencies with the same mechanical<br />
and infrastructural simplicity as when taking views on<br />
stocks. Similarly, within the ETF options market, investors<br />
can now take advantage of the benefits of optionality<br />
across a variety of asset classes.<br />
Even though the majority of ETF options volume is<br />
concentrated within four ETFs (three are equity funds;<br />
the other is gold), there is close to $6 billion of options<br />
notional traded per day in the remainder of liquid<br />
ETF options (Figure 3). Of the remaining ETF options<br />
volume, 75 percent ($4.4 billion) is in equity funds, 11<br />
percent ($671 million) in fixed-in<strong>com</strong>e funds, 10 percent<br />
($620 million) in <strong>com</strong>modity funds and 4 percent<br />
($208 million) in currency funds. In the next section,<br />
we take a closer look at size and growth in ETF options<br />
within each asset class.<br />
SPY, IWM and QQQ the most liquid ETF options<br />
within equities: Options on equity-based ETFs have<br />
approximately $36 billion notional traded per day with<br />
the SPY (S&P 500), IWM (Russell 2000) and QQQ<br />
(Nasdaq 100) making up $32 billion per day (Figure 4).<br />
Since its inception in 2005, options on SPY have grown<br />
tremendously and are now trading at approximately<br />
$26 billion notional per day. This growth can be attributed<br />
to the popularity of S&P 500 optionality (a global<br />
benchmark for equities), <strong>com</strong>bined with SPY’s minimal<br />
tracking error (as its underlying stocks are the largest<br />
U.S. <strong>com</strong>panies) to the S&P 500. Within the equity-asset<br />
class, the top three volume leaders represent a diverse<br />
selection of equities with access to U.S. large- and<br />
small-cap stocks (NYSE Arca: SPY and NYSE Arca: IWM)<br />
and technology stocks (Nasdaq GM: QQQ).<br />
The remaining equity ETF options outside the top three<br />
also represent a diverse array of investments. Liquid ETF<br />
options exist within the following categories:<br />
• International equities: MSCI EEM and EAFE, Brazil,<br />
China and Mexico<br />
Figure 4<br />
Median Notional Volume ($B)<br />
60<br />
50<br />
40<br />
30<br />
20<br />
10<br />
0<br />
Q1<br />
’99<br />
Q1<br />
’00<br />
Q1<br />
’01<br />
Equity-Based ETF Options<br />
Median Notional Volume ($B)<br />
SPY, IWM and QQQ are the<br />
most liquid ETF options<br />
within the equities asset class.<br />
Q1<br />
’02<br />
Source: BofA Merrill Lynch Global Research<br />
Q1<br />
’03<br />
Q1<br />
’04<br />
Q1<br />
’05<br />
Q1<br />
’06<br />
Q1<br />
’07<br />
Q1<br />
’08<br />
Q1<br />
’09<br />
■ SPY ■ IWM ■ QQQ ■ Other<br />
Q1<br />
’10<br />
Q1<br />
’11<br />
Q1<br />
’12<br />
12<br />
November / December 2012


