

Download complete issue - IndexUniverse.com
Download complete issue - IndexUniverse.com
Download complete issue - IndexUniverse.com

Create successful ePaper yourself
Turn your PDF publications into a flip-book with our unique Google optimized e-Paper software.
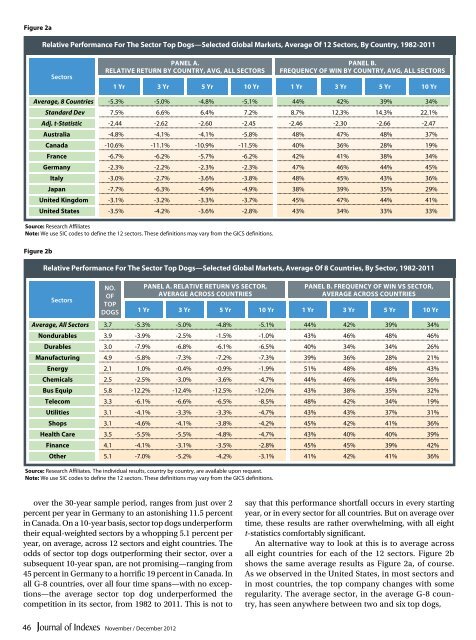
Figure 2a<br />
Relative Performance For The Sector Top Dogs—Selected Global Markets, Average Of 12 Sectors, By Country, 1982-2011<br />
Sectors<br />
Panel A.<br />
RELATIVE RETURN BY COUNTRY, AVG, ALL SECTORS<br />
Panel B.<br />
FREQUENCY OF WIN BY COUNTRY, AVG, ALL SECTORs<br />
1 Yr 3 Yr 5 Yr 10 Yr 1 Yr<br />
3 Yr<br />
5 Yr<br />
10 Yr<br />
Average, 8 Countries -5.3% -5.0% -4.8% -5.1% 44% 42% 39% 34%<br />
Standard Dev 7.5% 6.6% 6.4% 7.2% 8.7% 12.3% 14.3% 22.1%<br />
Adj. t-Statistic -2.44 -2.62 -2.60 -2.45 -2.46 -2.30 -2.66 -2.47<br />
australia -4.8% -4.1% -4.1% -5.8% 48% 47% 48% 37%<br />
Canada -10.6% -11.1% -10.9% -11.5% 40% 36% 28% 19%<br />
France -6.7% -6.2% -5.7% -6.2% 42% 41% 38% 34%<br />
Germany -2.3% -2.2% -2.3% -2.3% 47% 46% 44% 45%<br />
Italy -3.0% -2.7% -3.6% -3.8% 48% 45% 43% 36%<br />
Japan -7.7% -6.3% -4.9% -4.9% 38% 39% 35% 29%<br />
United Kingdom -3.1% -3.2% -3.3% -3.7% 45% 47% 44% 41%<br />
United States -3.5% -4.2% -3.6% -2.8% 43% 34% 33% 33%<br />
Source: Research Affiliates<br />
Note: We use SIC codes to define the 12 sectors. These definitions may vary from the GICS definitions.<br />
Figure 2b<br />
Relative Performance For The Sector Top Dogs—Selected Global Markets, Average Of 8 Countries, By Sector, 1982-2011<br />
Sectors<br />
No.<br />
of<br />
top<br />
dogs<br />
Panel A. Relative Return vs Sector,<br />
average across countries<br />
1 Yr 3 Yr 5 Yr 10 Yr 1 Yr<br />
3 Yr<br />
5 Yr<br />
10 Yr<br />
Source: Research Affiliates. The individual results, country by country, are available upon request.<br />
Note: We use SIC codes to define the 12 sectors. These definitions may vary from the GICS definitions.<br />
Panel B. Frequency of Win vs Sector,<br />
average across countries<br />
Average, All Sectors 3.7 -5.3% -5.0% -4.8% -5.1% 44% 42% 39% 34%<br />
Nondurables 3.9 -3.9% -2.5% -1.5% -1.0% 43% 46% 48% 46%<br />
Durables 3.0 -7.9% -6.8% -6.1% -6.5% 40% 34% 34% 26%<br />
Manufacturing 4.9 -5.8% -7.3% -7.2% -7.3% 39% 36% 28% 21%<br />
Energy 2.1 1.0% -0.4% -0.9% -1.9% 51% 48% 48% 43%<br />
Chemicals 2.5 -2.5% -3.0% -3.6% -4.7% 44% 46% 44% 36%<br />
Bus Equip 5.8 -12.2% -12.4% -12.5% -12.0% 43% 38% 35% 32%<br />
Tele<strong>com</strong> 3.3 -6.1% -6.6% -6.5% -8.5% 48% 42% 34% 19%<br />
Utilities 3.1 -4.1% -3.3% -3.3% -4.7% 43% 43% 37% 31%<br />
Shops 3.1 -4.6% -4.1% -3.8% -4.2% 45% 42% 41% 36%<br />
Health Care 3.5 -5.5% -5.5% -4.8% -4.7% 43% 40% 40% 39%<br />
Finance 4.1 -4.1% -3.1% -3.5% -2.8% 45% 45% 39% 42%<br />
Other 5.1 -7.0% -5.2% -4.2% -3.1% 41% 42% 41% 36%<br />
over the 30-year sample period, ranges from just over 2<br />
percent per year in Germany to an astonishing 11.5 percent<br />
in Canada. On a 10-year basis, sector top dogs underperform<br />
their equal-weighted sectors by a whopping 5.1 percent per<br />
year, on average, across 12 sectors and eight countries. The<br />
odds of sector top dogs outperforming their sector, over a<br />
subsequent 10-year span, are not promising—ranging from<br />
45 percent in Germany to a horrific 19 percent in Canada. In<br />
all G-8 countries, over all four time spans—with no exceptions—the<br />
average sector top dog underperformed the<br />
<strong>com</strong>petition in its sector, from 1982 to 2011. This is not to<br />
say that this performance shortfall occurs in every starting<br />
year, or in every sector for all countries. But on average over<br />
time, these results are rather overwhelming, with all eight<br />
t-statistics <strong>com</strong>fortably significant.<br />
An alternative way to look at this is to average across<br />
all eight countries for each of the 12 sectors. Figure 2b<br />
shows the same average results as Figure 2a, of course.<br />
As we observed in the United States, in most sectors and<br />
in most countries, the top <strong>com</strong>pany changes with some<br />
regularity. The average sector, in the average G-8 country,<br />
has seen anywhere between two and six top dogs,<br />
46<br />
November / December 2012


