

Download complete issue - IndexUniverse.com
Download complete issue - IndexUniverse.com
Download complete issue - IndexUniverse.com

Create successful ePaper yourself
Turn your PDF publications into a flip-book with our unique Google optimized e-Paper software.
Relative Value Trading<br />
In lower-correlation environments, there is differentiation<br />
in performance across and within asset classes exists.<br />
Given the breadth of the ETF and ETF options market,<br />
investors can take a view on the spread between two<br />
assets—at the sector, country or cross-asset level.<br />
For example, using sector ETFs, investors can trade a<br />
single stock against a basket of its peers (same sector), thus<br />
allowing one to isolate the fundamentals of a particular<br />
<strong>com</strong>pany in a relative value trade. Or investors can trade<br />
the outperformance between two equity sectors. Likewise,<br />
with country-specific ETFs, investors can play an outperformance<br />
between regions. Even further, ETFs allow for<br />
views across assets to play the relative value between any<br />
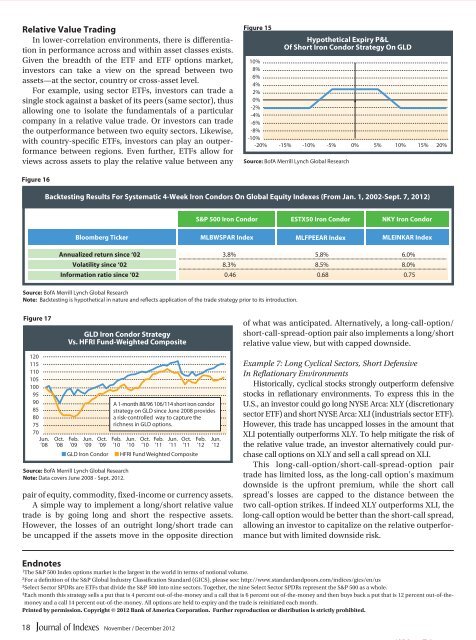
Figure 15<br />
Hypothetical Expiry P&L<br />
Of Short Iron Condor Strategy On GLD<br />
10%<br />
8%<br />
6%<br />
4%<br />
2%<br />
0%<br />
-2%<br />
-4%<br />
-6%<br />
-8%<br />
-10%<br />
-20% -15% -10% -5% 0% 5% 10% 15% 20%<br />
Source: BofA Merrill Lynch Global Research<br />
Figure 16<br />
Backtesting Results For Systematic 4-Week Iron Condors On Global Equity Indexes (From Jan. 1, 2002-Sept. 7, 2012)<br />
S&P 500 Iron Condor<br />
ESTX50 Iron Condor<br />
NKY Iron Condor<br />
Bloomberg Ticker<br />
MLBWSPAR Index<br />
MLFPEEAR Index<br />
MLEINKAR Index<br />
Annualized return since ‘02 3.8% 5.8% 6.0%<br />
Volatility since ‘02 8.3% 8.5% 8.0%<br />
Information ratio since ‘02 0.46 0.68 0.75<br />
Source: BofA Merrill Lynch Global Research<br />
Note: Backtesting is hypothetical in nature and reflects application of the trade strategy prior to its introduction.<br />
Figure 17<br />
120<br />
115<br />
110<br />
105<br />
100<br />
95<br />
90<br />
85<br />
80<br />
75<br />
70<br />
Jun.<br />
’08<br />
GLD Iron Condor Strategy<br />
Vs. HFRI Fund-Weighted Composite<br />
Oct. Feb. Jun. Oct. Feb. Jun. Oct. Feb. Jun. Oct. Feb.<br />
’08 ’09 ’09 ’09 ’10 ’10 ’10 ’11 ’11 ’11 ’12<br />
■ GLD Iron Condor<br />
Source: BofA Merrill Lynch Global Research<br />
Note: Data covers June 2008 - Sept. 2012.<br />
A 1-month 88/96 106/114 short iron condor<br />
strategy on GLD since June 2008 provides<br />
a risk-controlled way to capture the<br />
richness in GLD options.<br />
■ HFRI Fund Weighted Composite<br />
pair of equity, <strong>com</strong>modity, fixed-in<strong>com</strong>e or currency assets.<br />
A simple way to implement a long/short relative value<br />
trade is by going long and short the respective assets.<br />
However, the losses of an outright long/short trade can<br />
be uncapped if the assets move in the opposite direction<br />
Jun.<br />
’12<br />
of what was anticipated. Alternatively, a long-call-option/<br />
short-call-spread-option pair also implements a long/short<br />
relative value view, but with capped downside.<br />
Example 7: Long Cyclical Sectors, Short Defensive<br />
In Reflationary Environments<br />
Historically, cyclical stocks strongly outperform defensive<br />
stocks in reflationary environments. To express this in the<br />
U.S., an investor could go long NYSE Arca: XLY (discretionary<br />
sector ETF) and short NYSE Arca: XLI (industrials sector ETF).<br />
However, this trade has uncapped losses in the amount that<br />
XLI potentially outperforms XLY. To help mitigate the risk of<br />
the relative value trade, an investor alternatively could purchase<br />
call options on XLY and sell a call spread on XLI.<br />
This long-call-option/short-call-spread-option pair<br />
trade has limited loss, as the long-call option’s maximum<br />
downside is the upfront premium, while the short call<br />
spread’s losses are capped to the distance between the<br />
two call-option strikes. If indeed XLY outperforms XLI, the<br />
long-call option would be better than the short-call spread,<br />
allowing an investor to capitalize on the relative outperformance<br />
but with limited downside risk.<br />
Endnotes<br />
1 The S&P 500 Index options market is the largest in the world in terms of notional volume.<br />
2 For a definition of the S&P Global Industry Classification Standard (GICS), please see: http://www.standardandpoors.<strong>com</strong>/indices/gics/en/us<br />
3 Select Sector SPDRs are ETFs that divide the S&P 500 into nine sectors. Together, the nine Select Sector SPDRs represent the S&P 500 as a whole.<br />
4 Each month this strategy sells a put that is 4 percent out-of-the-money and a call that is 6 percent out of-the-money and then buys back a put that is 12 percent out-of-themoney<br />
and a call 14 percent out-of-the-money. All options are held to expiry and the trade is reinitiated each month.<br />
Printed by permission. Copyright © 2012 Bank of America Corporation. Further reproduction or distribution is strictly prohibited.<br />
18<br />
November / December 2012


