

Download complete issue - IndexUniverse.com
Download complete issue - IndexUniverse.com
Download complete issue - IndexUniverse.com

You also want an ePaper? Increase the reach of your titles
YUMPU automatically turns print PDFs into web optimized ePapers that Google loves.
The following steps are taken to select spread pair <strong>com</strong>ponents<br />
for each index:<br />
i) Establish total population of available SPY option contracts<br />
for the front and second month.<br />
ii) Refine selection universe based on eligibility/liquidity<br />
requirements.<br />
iii) Create all possible ATM vertical spread pairs.<br />
iv) Create and equal-weight overall rank for each pair by<br />
calculating and ranking on various criteria based on factors<br />
such as strike spread and net credit.<br />
v) Based on the sold leg of each spread, determine the<br />
distance away from ATM (money-ness).<br />
vi) Allocate spread pairs along proprietary money-ness<br />
and expiration criteria.<br />
vii) Apply an equal weighting to all spread pairs.<br />
Index <strong>com</strong>ponents are evaluated using bid/ask pricing.<br />
Midpoint pricing is used for the real-time and end-of-day<br />
index level calculation. The index is rebalanced monthly in<br />
conjunction with the regular options expiration calendar.<br />
To manage downside volatility, each index employs<br />
loss floors at the individual spread level. Once a spread<br />
pair has priced through the floor on an end-of-day basis,<br />
the <strong>com</strong>ponent’s weight in the index is allocated away<br />
from the spread pair and moved to a cash proxy until the<br />
next rebalance cycle. While this approach is effective in<br />
managing downside risk over a few days or in between<br />
rebalance cycles, it is ineffective in controlling any oneday<br />
market event. Managing downside risk in this manner<br />
not only limits losses but mitigates the risk of any positions<br />
being assigned and forcing the delivery of shares of<br />
the underlying for any investor following the index.<br />
Figure 5 shows this loss floor in action. This graph<br />
highlights the <strong><strong>com</strong>plete</strong> options cycle for December 2011<br />
(11/18/2011 to 12/16/2011). In the December period,<br />
SPY trades off early in the cycle and we see the bullish<br />
index trading off as well. What is hidden is the loss-floor<br />
mechanism. Figure 6 provides an analysis of index <strong>com</strong>ponents<br />
during this period.<br />
The loss-floor mechanism allows for those positions<br />
that could cause more drag on performance to be allocated<br />
to cash, and without significant lag. It sometimes<br />
is the case with sharp moves in SPY that the entire index<br />
spends some time during the expiration cycle allocated<br />
<strong><strong>com</strong>plete</strong>ly to the cash proxy, but as mentioned earlier,<br />
the cash proxy weight is reallocated to new spread pairs<br />
in the next rebalance cycle. The example given represents<br />
one period and is unique, meaning it will not<br />
always be the case that a -2.21 percent move in SPY will<br />
result in 27 spread pairs being reallocated to the cash<br />
proxy, or more generically, that an aggregate move of X<br />
percent in the underlying will always result in a particular<br />
action occurring in the index.<br />
Unlike other options strategy indexes, these indexes<br />
solely include options contracts and do not contain any<br />
underlying security as a <strong>com</strong>ponent. In designing these<br />
indexes, we realized that investors looking for optionoverlay<br />
products wanted just that—an option overlay. It<br />
did not make sense to force investors to double-up on<br />
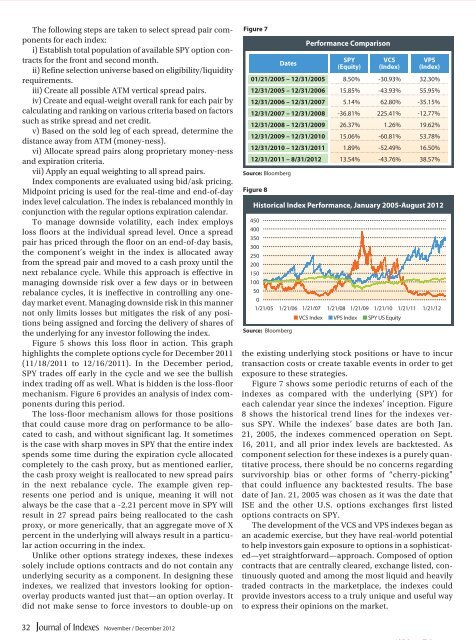
Figure 7<br />
Figure 8<br />
Dates<br />
Source: Bloomberg<br />
Performance Comparison<br />
SPY<br />
(Equity)<br />
VCS<br />
(Index)<br />
VPS<br />
(Index)<br />
01/21/2005 – 12/31/2005 8.50% -30.93% 32.30%<br />
12/31/2005 – 12/31/2006 15.85% -43.93% 55.95%<br />
12/31/2006 – 12/31/2007 5.14% 62.80% -35.15%<br />
12/31/2007 – 12/31/2008 -36.81% 225.41% -12.77%<br />
12/31/2008 – 12/31/2009 26.37% 1.26% 19.62%<br />
12/31/2009 – 12/31/2010 15.06% -60.81% 53.78%<br />
12/31/2010 – 12/31/2011 1.89% -52.49% 16.50%<br />
12/31/2011 – 8/31/2012 13.54% -43.76% 38.57%<br />
Source: Bloomberg<br />
Historical Index Performance, January 2005-August 2012<br />
450<br />
400<br />
350<br />
300<br />
250<br />
200<br />
150<br />
100<br />
50<br />
0<br />
1/21/05 1/21/06 1/21/07 1/21/08 1/21/09 1/21/10 1/21/11 1/21/12<br />
■ VCS Index ■ VPS Index ■ SPY US Equity<br />
the existing underlying stock positions or have to incur<br />
transaction costs or create taxable events in order to get<br />
exposure to these strategies.<br />
Figure 7 shows some periodic returns of each of the<br />
indexes as <strong>com</strong>pared with the underlying (SPY) for<br />
each calendar year since the indexes’ inception. Figure<br />
8 shows the historical trend lines for the indexes versus<br />
SPY. While the indexes’ base dates are both Jan.<br />
21, 2005, the indexes <strong>com</strong>menced operation on Sept.<br />
16, 2011, and all prior index levels are backtested. As<br />
<strong>com</strong>ponent selection for these indexes is a purely quantitative<br />
process, there should be no concerns regarding<br />
survivorship bias or other forms of “cherry-picking”<br />
that could influence any backtested results. The base<br />
date of Jan. 21, 2005 was chosen as it was the date that<br />
ISE and the other U.S. options exchanges first listed<br />
options contracts on SPY.<br />
The development of the VCS and VPS indexes began as<br />
an academic exercise, but they have real-world potential<br />
to help investors gain exposure to options in a sophisticated—yet<br />
straightforward—approach. Composed of option<br />
contracts that are centrally cleared, exchange listed, continuously<br />
quoted and among the most liquid and heavily<br />
traded contracts in the marketplace, the indexes could<br />
provide investors access to a truly unique and useful way<br />
to express their opinions on the market.<br />
32<br />
November / December 2012


