

Download complete issue - IndexUniverse.com
Download complete issue - IndexUniverse.com
Download complete issue - IndexUniverse.com

Create successful ePaper yourself
Turn your PDF publications into a flip-book with our unique Google optimized e-Paper software.
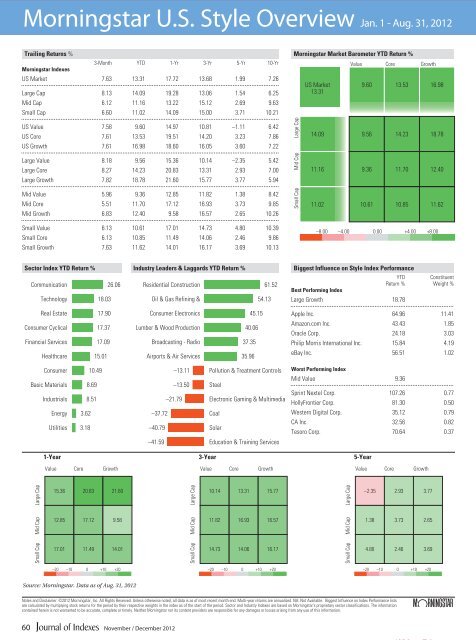
Morningstar U.S. Style Overview Jan. 1 - Aug. 31, 2012<br />
Trailing Returns %<br />
3-Month YTD 1-Yr 3-Yr 5-Yr 10-Yr<br />
Morningstar Indexes<br />
US Market 7.63 13.31 17.72 13.68 1.99 7.26<br />
Large Cap 8.13 14.09 19.28 13.06 1.54 6.25<br />
Mid Cap 6.12 11.16 13.22 15.12 2.69 9.63<br />
Small Cap 6.60 11.02 14.09 15.00 3.71 10.21<br />
US Value 7.58 9.60 14.97 10.81 –1.11 6.42<br />
US Core 7.61 13.53 19.51 14.20 3.23 7.86<br />
US Growth 7.61 16.98 18.60 16.05 3.60 7.22<br />
Morningstar Market Barometer YTD Return %<br />
Large Cap<br />
US Market<br />
13.31<br />
14.09<br />
Value<br />
9.60<br />
Core<br />
13.53<br />
Growth<br />
16.98<br />
9.56 14.23 18.78<br />
Large Value 8.18 9.56 15.36 10.14 –2.35 5.42<br />
Large Core 8.27 14.23 20.83 13.31 2.93 7.00<br />
Large Growth 7.82 18.78 21.60 15.77 3.77 5.94<br />
Mid Cap<br />
11.16<br />
9.36 11.70 12.40<br />
Mid Value 5.96 9.36 12.85 11.82 1.38 8.42<br />
Mid Core 5.51 11.70 17.12 16.93 3.73 9.85<br />
Mid Growth 6.83 12.40 9.58 16.57 2.65 10.26<br />
Small Cap<br />
11.02<br />
10.61 10.85 11.62<br />
Small Value 6.13 10.61 17.01 14.73 4.80 10.39<br />
Small Core 6.13 10.85 11.49 14.06 2.46 9.86<br />
Small Growth 7.63 11.62 14.01 16.17 3.69 10.13<br />
–8.00 –4.00 0.00 +4.00 +8.00<br />
Sector Index YTD Return %<br />
Communication 26.06<br />
Technology 18.03<br />
Industry Leaders & Laggards YTD Return %<br />
Residential Construction 61.52<br />
Oil & Gas Refining & 54.13<br />
Biggest Influence on Style Index Performance<br />
Best Performing Index<br />
YTD<br />
Return %<br />
Large Growth 18.78<br />
Constituent<br />
Weight %<br />
Real Estate 17.90<br />
Consumer Cyclical 17.37<br />
Financial Services 17.09<br />
Healthcare 15.01<br />
Consumer 10.49<br />
Basic Materials 8.69<br />
Industrials 8.51<br />
Energy 3.62<br />
Utilities 3.18<br />
Consumer Electronics 45.15<br />
Lumber & Wood Production 40.06<br />
Broadcasting - Radio 37.35<br />
Airports & Air Services 35.96<br />
–13.11 Pollution & Treatment Controls<br />
–13.50 Steel<br />
–21.79 Electronic Gaming & Multimedia<br />
–37.72 Coal<br />
–40.79 Solar<br />
–41.59 Education & Training Services<br />
Apple Inc. 64.96 11.41<br />
Amazon.<strong>com</strong> Inc. 43.43 1.85<br />
Oracle Corp. 24.18 3.03<br />
Philip Morris International Inc. 15.84 4.19<br />
eBay Inc. 56.51 1.02<br />
Worst Performing Index<br />
Mid Value 9.36<br />
Sprint Nextel Corp. 107.26 0.77<br />
HollyFrontier Corp. 81.30 0.50<br />
Western Digital Corp. 35.12 0.79<br />
CA Inc. 32.56 0.82<br />
Tesoro Corp. 70.64 0.37<br />
1-Year<br />
3-Year<br />
5-Year<br />
Value<br />
Core<br />
Growth<br />
Value<br />
Core<br />
Growth<br />
Value<br />
Core<br />
Growth<br />
Large Cap<br />
15.36<br />
20.83<br />
21.60<br />
Large Cap<br />
10.14<br />
13.31<br />
15.77<br />
Large Cap<br />
–2.35<br />
2.93<br />
3.77<br />
Mid Cap<br />
12.85<br />
17.12 9.58<br />
Mid Cap<br />
11.82<br />
16.93 16.57<br />
Mid Cap<br />
1.38<br />
3.73 2.65<br />
Small Cap<br />
17.01<br />
11.49 14.01<br />
Small Cap<br />
14.73<br />
14.06 16.17<br />
Small Cap<br />
4.80<br />
2.46 3.69<br />
–20 –10 0 +10 +20<br />
–20 –10 0 +10 +20<br />
–20 –10 0 +10 +20<br />
Source: Morningstar. Data as of Aug. 31, 2012<br />
Source: Morningstar. Data as of Feb. 29, 2012.<br />
Notes and Disclaimer: ©2012 Morningstar, Inc. All Rights Reserved. Unless otherwise noted, all data is as of most recent month end. Multi-year returns are annualized. NA: Not Available. Biggest Influence on Index Performance lists<br />
are calculated by multiplying stock returns for the period by their respective weights in the index as of the start of the period. Sector and Industry Indexes are based on Morningstar's proprietary sector classifications. The information ?<br />
contained herein is not warranted to be accurate, <strong><strong>com</strong>plete</strong> or timely. Neither Morningstar nor its content providers are responsible for any damages or losses arising from any use of this information.<br />
60<br />
November / December 2012


