

Download complete issue - IndexUniverse.com
Download complete issue - IndexUniverse.com
Download complete issue - IndexUniverse.com

Create successful ePaper yourself
Turn your PDF publications into a flip-book with our unique Google optimized e-Paper software.
equired to establish this position and is the basis for all<br />
gain/loss calculations.<br />
The vertical bull put spread is a neutral-to-bullish<br />
multileg options strategy (Figure 4). Premium is collected<br />
through the sale of a put (obligation to receive the underlying<br />
stock). Part of the premium received is used to buy<br />
a put (right to sell the underlying stock) at a lower strike<br />
price. Selling a put theoretically represents risk equal to the<br />
contract strike price. Buying a put limits the risk to the difference<br />
between the sold and bought strike prices (strike<br />
spread) less any premium collected. For example:<br />
SLD: SPY NOV 140 PUT @ 4.55 (receive $455)<br />
BOT: SPY SEP 137 PUT @ 3.45 (pay $345)<br />
Net Credit: $455 - $345 = $110<br />
$-At-Risk:<br />
Difference in Strikes – Net Credit<br />
((140 – 137) x 100) - $110 = $190<br />
MAX Gain/Loss: Max Gain = $110 (36.67%) /<br />
Max Loss = $193 (-63.33%)<br />
Collateral for this position would generally be determined<br />
by the strike spread. Collateral of $300 would be required to<br />
establish this position and is the basis for all G/L calculations.<br />
Benchmarking Options Strategies<br />
The spreads described here are typical in that this<br />
trade is usually constructed to sell the ATM and use the<br />
proceeds to purchase insurance a certain percentage<br />
away from ATM. This is a classic, risk-controlled trade.<br />
ISE took the framework of this trade and blended it with<br />
modern portfolio theory to develop a truly diversified<br />
portfolio of vertical spread trades to help transform a<br />
trading vehicle into a potential investment vehicle.<br />
Spread pairs that are very close to or ATM are more<br />
likely to have the underlying stock trade through them<br />
and incur maximum losses (high delta/low gamma).<br />
Pairs that are further away from ATM are less attractive<br />
from a net credit perspective, but require larger moves<br />
of the underlying to put the position at risk (mid delta/<br />
mid gamma). Pairs that are quite far away from ATM<br />
exhibit higher levels of price volatility (low delta/high<br />
gamma) due to the low absolute-price levels at which<br />
they trade. Being positioned too close or too far away<br />
from ATM presents unique risks for each. We identified<br />
optimal spreads from each of these categories and <strong>com</strong>bine<br />
them into a single basket. In doing so, we created<br />
the ISE SPY Bear Options Overlay Index (VCS) and the<br />
ISE SPY Bull Options Overlay Index (VPS).<br />
The ISE Options Overlay indexes provide benchmarks<br />
for investors looking to track the performance of a<br />
diversified portfolio of exchange-listed options utilizing<br />
the vertical spread strategy. As indicated by the name,<br />
each index solely includes option contracts on the SPDR<br />
S&P 500 exchange-traded fund (NYSE Arca: SPY).<br />
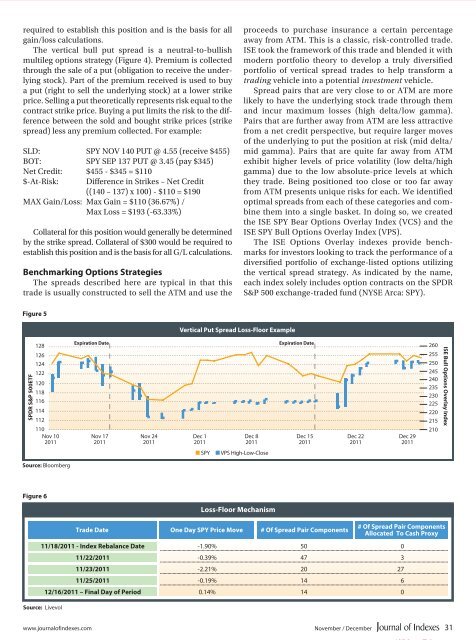
Figure 5<br />
Vertical Put Spread Loss-Floor Example<br />
SPDR S&P 500ETF<br />
128<br />
126<br />
124<br />
122<br />
120<br />
118<br />
116<br />
114<br />
112<br />
110<br />
Nov 10<br />
2011<br />
Expiration Date<br />
Nov 17<br />
2011<br />
Nov 24<br />
2011<br />
Dec 1<br />
2011<br />
Dec 8<br />
2011<br />
Expiration Date<br />
Dec 15<br />
2011<br />
Dec 22<br />
2011<br />
Dec 29<br />
2011<br />
260<br />
255<br />
250<br />
245<br />
240<br />
235<br />
230<br />
225<br />
220<br />
215<br />
210<br />
ISE Bull Options Overlay Index<br />
■ SPY<br />
■ VPS High-Low-Close<br />
Source: Bloomberg<br />
Figure 6<br />
Trading Trade Date<br />
Symbol<br />
One Day SPY Price Move<br />
# 3-Month Of Spread Average Pair Components<br />
Daily Volume<br />
# Of Spread Pair Components<br />
Allocated To Cash Proxy<br />
11/18/2011 - Index Rebalance Date -1.90% 50 0<br />
Source: Livevol<br />
Loss-Floor Mechanism<br />
11/22/2011 -0.39% 47 3<br />
11/23/2011 -2.21% 20 27<br />
11/25/2011 -0.19% 14 6<br />
12/16/2011 – Final Day of Period 0.14% 14 0<br />
www.journalofindexes.<strong>com</strong> November / December 31


