

Download complete issue - IndexUniverse.com
Download complete issue - IndexUniverse.com
Download complete issue - IndexUniverse.com

You also want an ePaper? Increase the reach of your titles
YUMPU automatically turns print PDFs into web optimized ePapers that Google loves.
Exchange-Traded Dow Jones U.S. Industry Funds Review Corner<br />
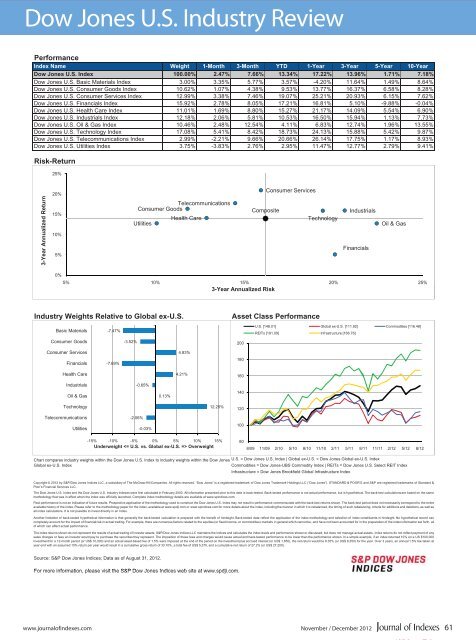
Performance<br />
Index Name Weight 1-Month 3-Month YTD 1-Year 3-Year 5-Year 10-Year<br />
Dow Jones U.S. Index 100.00% 2.47% 7.66% 13.34% 17.22% 13.96% 1.71% 7.18%<br />
Dow Jones U.S. Basic Materials Index 3.00% 3.35% 5.77% 3.57% -4.20% 11.64% 1.49% 8.64%<br />
Dow Jones U.S. Consumer Goods Index 10.62% 1.07% 4.38% 9.53% 13.77% 16.37% 6.58% 8.28%<br />
Dow Jones U.S. Consumer Services Index 12.99% 3.38% 7.46% 19.07% 25.21% 20.93% 6.15% 7.62%<br />
Dow Jones U.S. Financials Index 15.92% 2.78% 8.05% 17.21% 16.81% 5.10% -9.88% -0.04%<br />
Dow Jones U.S. Health Care Index 11.01% 1.69% 8.80% 15.27% 21.17% 14.09% 5.54% 6.90%<br />
Dow Jones U.S. Industrials Index 12.18% 2.06% 5.81% 10.53% 16.50% 15.94% 1.13% 7.73%<br />
Dow Jones U.S. Oil & Gas Index 10.46% 2.48% 12.54% 4.11% 6.83% 12.74% 1.96% 13.55%<br />
Dow Jones U.S. Technology Index 17.08% 5.41% 8.42% 18.73% 24.13% 15.88% 5.42% 9.87%<br />
Dow Jones U.S. Tele<strong>com</strong>munications Index 2.99% -2.21% 9.66% 20.66% 26.14% 17.75% 1.17% 8.93%<br />
Dow Jones U.S. Utilities Index 3.75% -3.83% 2.76% 2.95% 11.47% 12.77% 2.79% 9.41%<br />
Risk-Return<br />
25%<br />
3-Year Annualized Return<br />
Consumer Services<br />
20%<br />
Tele<strong>com</strong>munications<br />
Consumer Goods<br />
Composite<br />
Industrials<br />
15%<br />
Health Care<br />
Technology<br />
Utilities<br />
10%<br />
Financials<br />
5%<br />
Oil & Gas<br />
0%<br />
5% 10% 15% 20% 25%<br />
3-Year Annualized Risk<br />
Industry Weights Relative to Global ex-U.S.<br />
Basic Materials -7.47%<br />
Consumer Goods<br />
-3.52%<br />
Asset Class Performance<br />
U.S. [148.01] Global ex-U.S. [111.92] Commodities [116.48]<br />
REITs [191.09] Infrastructure [166.76]<br />
200<br />
Consumer Services<br />
Financials<br />
-7.69%<br />
4.83%<br />
180<br />
Health Care<br />
4.21%<br />
160<br />
Industrials<br />
-0.65%<br />
Oil & Gas<br />
0.13%<br />
140<br />
Technology<br />
12.25%<br />
120<br />
Tele<strong>com</strong>munications<br />
-2.06%<br />
Utilities<br />
-0.03%<br />
100<br />
-15% -10% -5% 0% 5% 10% 15%<br />
Underweight Overweight<br />
80<br />
8/09 11/09 2/10 5/10 8/10 11/10 2/11 5/11 8/11 11/11 2/12 5/12 8/12<br />
Chart <strong>com</strong>pares industry weights within the Dow Jones U.S. Index to industry weights within the Dow Jones U.S. = Dow Jones U.S. Index | Global ex-U.S. = Dow Jones Global ex-U.S. Index<br />
Global ex-U.S. Index<br />
Commodities = Dow Jones-UBS Commodity Index | REITs = Dow Jones U.S. Select REIT Index<br />
Infrastructure = Dow Jones Brookfield Global Infrastructure Index<br />
Copyright © 2012 by S&P/Dow Jones Indices LLC, a subsidiary of The McGraw-Hill Companies. All rights reserved. “Dow Jones” is a registered trademark of Dow Jones Trademark Holdings LLC (“Dow Jones”). STANDARD & POOR’S and S&P are registered trademarks of Standard &<br />
Poor’s Financial Services LLC.<br />
The Dow Jones U.S. Index and the Dow Jones U.S. Industry Indexes were first calculated in February 2000. All information presented prior to this date is back-tested. Back-tested performance is not actual performance, but is hypothetical. The back-test calculations are based on the same<br />
methodology that was in effect when the index was officially launched. Complete index methodology details are available at www.spindices.<strong>com</strong>.<br />
Past performance is not an indication of future results. Prospective application of the methodology used to construct the Dow Jones U.S. Index may not result in performance <strong>com</strong>mensurate with the back-test returns shown. The back-test period does not necessarily correspond to the entire<br />
available history of the index. Please refer to the methodology paper for the index, available at www.spdji.<strong>com</strong> or www.spindices.<strong>com</strong> for more details about the index, including the manner in which it is rebalanced, the timing of such rebalancing, criteria for additions and deletions, as well as<br />
all index calculations. It is not possible to invest directly in an Index.<br />
Another limitation of back-tested hypothetical information is that generally the back-tested calculation is prepared with the benefit of hindsight. Back-tested data reflect the application of the index methodology and selection of index constituents in hindsight. No hypothetical record can<br />
<strong><strong>com</strong>plete</strong>ly account for the impact of financial risk in actual trading. For example, there are numerous factors related to the equities (or fixed in<strong>com</strong>e, or <strong>com</strong>modities) markets in general which cannot be, and have not been accounted for in the preparation of the index information set forth, all<br />
of which can affect actual performance.<br />
The index returns shown do not represent the results of actual trading of investor assets. S&P/Dow Jones Indices LLC maintains the indices and calculates the index levels and performance shown or discussed, but does not manage actual assets. Index returns do not reflect payment of any<br />
sales charges or fees an investor would pay to purchase the securities they represent. The imposition of these fees and charges would cause actual and back-tested performance to be lower than the performance shown. In a simple example, if an index returned 10% on a US $100,000<br />
investment for a 12-month period (or US$ 10,000) and an actual asset-based fee of 1.5% were imposed at the end of the period on the investment plus accrued interest (or US$ 1,650), the net return would be 8.35% (or US$ 8,350) for the year. Over 3 years, an annual 1.5% fee taken at<br />
year end with an assumed 10% return per year would result in a cumulative gross return of 33.10%, a total fee of US$ 5,375, and a cumulative net return of 27.2% (or US$ 27,200).<br />
Source: S&P Dow Jones Indices; Data as of August 31, 2012.<br />
For more information, please visit the S&P Dow Jones Indices web site at www.spdji.<strong>com</strong>.<br />
www.journalofindexes.<strong>com</strong><br />
November / December 2012 61


