

Download complete issue - IndexUniverse.com
Download complete issue - IndexUniverse.com
Download complete issue - IndexUniverse.com

Create successful ePaper yourself
Turn your PDF publications into a flip-book with our unique Google optimized e-Paper software.
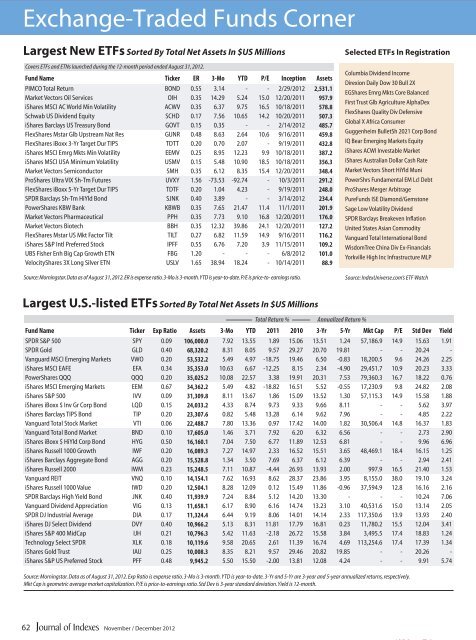
Exchange-Traded Funds Corner<br />
Largest New ETFs Sorted By Total Net Assets In $US Millions<br />
Covers ETFs and ETNs launched during the 12-month period ended August 31, 2012.<br />
Fund Name Ticker ER 3-Mo YTD P/E Inception Assets<br />
PIMCO Total Return BOND 0.55 3.14 - - 2/29/2012 2,531.1<br />
Market Vectors Oil Services OIH 0.35 14.29 5.24 15.0 12/20/2011 957.9<br />
iShares MSCI AC World Min Volatility ACWV 0.35 6.37 9.75 16.5 10/18/2011 578.8<br />
Schwab US Dividend Equity SCHD 0.17 7.56 10.65 14.2 10/20/2011 507.3<br />
iShares Barclays US Treasury Bond GOVT 0.15 0.35 - - 2/14/2012 485.7<br />
FlexShares Mstar Glb Upstream Nat Res GUNR 0.48 8.63 2.64 10.6 9/16/2011 459.8<br />
FlexShares iBoxx 3-Yr Target Dur TIPS TDTT 0.20 0.70 2.07 - 9/19/2011 432.8<br />
iShares MSCI Emrg Mkts Min Volatility EEMV 0.25 8.95 12.23 9.9 10/18/2011 387.2<br />
iShares MSCI USA Minimum Volatility USMV 0.15 5.48 10.90 18.5 10/18/2011 356.3<br />
Market Vectors Semiconductor SMH 0.35 6.12 8.35 15.4 12/20/2011 348.4<br />
ProShares Ultra VIX Sh-Tm Futures UVXY 1.56 -73.53 -92.74 - 10/3/2011 291.2<br />
FlexShares iBoxx 5-Yr Target Dur TIPS TDTF 0.20 1.04 4.23 - 9/19/2011 248.0<br />
SPDR Barclays Sh-Tm HiYld Bond SJNK 0.40 3.89 - - 3/14/2012 234.4<br />
PowerShares KBW Bank KBWB 0.35 7.65 21.47 11.4 11/1/2011 201.9<br />
Market Vectors Pharmaceutical PPH 0.35 7.73 9.10 16.8 12/20/2011 176.0<br />
Market Vectors Biotech BBH 0.35 12.32 39.86 24.1 12/20/2011 127.2<br />
FlexShares Mstar US Mkt Factor Tilt TILT 0.27 6.82 11.59 14.9 9/16/2011 116.2<br />
iShares S&P Intl Preferred Stock IPFF 0.55 6.76 7.20 3.9 11/15/2011 109.2<br />
UBS Fisher Enh Big Cap Growth ETN FBG 1.20 - - - 6/8/2012 101.0<br />
VelocityShares 3X Long Silver ETN USLV 1.65 38.94 18.24 - 10/14/2011 88.9<br />
Source: Morningstar. Data as of August 31, 2012. ER is expense ratio. 3-Mo is 3-month. YTD is year-to-date. P/E is price-to- earnings ratio.<br />
Selected ETFs In Registration<br />
Columbia Dividend In<strong>com</strong>e<br />
Direxion Daily Dow 30 Bull 2X<br />
EGShares Emrg Mkts Core Balanced<br />
First Trust Glb Agriculture AlphaDex<br />
FlexShares Quality Div Defensive<br />
Global X Africa Consumer<br />
Guggenheim BulletSh 2021 Corp Bond<br />
IQ Bear Emerging Markets Equity<br />
iShares ACWI Investable Market<br />
iShares Australian Dollar Cash Rate<br />
Market Vectors Short HiYld Muni<br />
PowerShrs Fundamental EM Lcl Debt<br />
ProShares Merger Arbitrage<br />
PureFunds ISE Diamond/Gemstone<br />
Sage Low Volatility Dividend<br />
SPDR Barclays Breakeven Inüation<br />
United States Asian Commodity<br />
Vanguard Total International Bond<br />
WisdomTree China Div Ex-Financials<br />
Yorkville High Inc Infrastructure MLP<br />
Source: <strong>IndexUniverse</strong>.<strong>com</strong>’s ETF Watch<br />
Largest U.S.-listed ETFs Sorted By Total Net Assets In $US Millions<br />
Total Return % Annualized Return %<br />
Fund Name Ticker Exp Ratio Assets 3-Mo YTD 2011 2010 3-Yr 5-Yr Mkt Cap P/E Std Dev Yield<br />
SPDR S&P 500 SPY 0.09 106,000.0 7.92 13.55 1.89 15.06 13.51 1.24 57,186.9 14.9 15.63 1.91<br />
SPDR Gold GLD 0.40 68,320.2 8.31 8.05 9.57 29.27 20.70 19.81 - - 20.24 -<br />
Vanguard MSCI Emerging Markets VWO 0.20 53,532.2 5.49 4.97 -18.75 19.46 6.50 -0.83 18,200.5 9.6 24.26 2.25<br />
iShares MSCI EAFE EFA 0.34 35,353.0 10.63 6.67 -12.25 8.15 2.34 -4.90 29,451.7 10.9 20.23 3.33<br />
PowerShares QQQ QQQ 0.20 35,025.2 10.08 22.57 3.38 19.91 20.31 7.53 79,360.3 16.7 18.22 0.76<br />
iShares MSCI Emerging Markets EEM 0.67 34,362.2 5.49 4.82 -18.82 16.51 5.52 -0.55 17,230.9 9.8 24.82 2.08<br />
iShares S&P 500 IVV 0.09 31,309.8 8.11 13.67 1.86 15.09 13.52 1.30 57,115.3 14.9 15.58 1.88<br />
iShares iBoxx $ Inv Gr Corp Bond LQD 0.15 24,033.2 4.33 8.74 9.73 9.33 9.66 8.11 - - 5.62 3.97<br />
iShares Barclays TIPS Bond TIP 0.20 23,307.6 0.82 5.48 13.28 6.14 9.62 7.96 - - 4.85 2.22<br />
Vanguard Total Stock Market VTI 0.06 22,488.7 7.80 13.36 0.97 17.42 14.00 1.82 30,506.4 14.8 16.37 1.83<br />
Vanguard Total Bond Market BND 0.10 17,605.0 1.46 3.71 7.92 6.20 6.32 6.56 - - 2.73 2.90<br />
iShares iBoxx $ HiYld Corp Bond HYG 0.50 16,160.1 7.04 7.50 6.77 11.89 12.53 6.81 - - 9.96 6.96<br />
iShares Russell 1000 Growth IWF 0.20 16,089.3 7.27 14.97 2.33 16.52 15.51 3.65 48,469.1 18.4 16.15 1.25<br />
iShares Barclays Aggregate Bond AGG 0.20 15,528.8 1.34 3.50 7.69 6.37 6.12 6.39 - - 2.94 2.41<br />
iShares Russell 2000 IWM 0.23 15,248.5 7.11 10.87 -4.44 26.93 13.93 2.00 997.9 16.5 21.40 1.53<br />
Vanguard REIT VNQ 0.10 14,154.1 7.62 16.93 8.62 28.37 23.86 3.95 8,155.0 38.0 19.10 3.24<br />
iShares Russell 1000 Value IWD 0.20 12,504.1 8.28 12.09 0.12 15.49 11.86 -0.96 37,594.9 12.8 16.16 2.16<br />
SPDR Barclays High Yield Bond JNK 0.40 11,939.9 7.24 8.84 5.12 14.20 13.30 - - - 10.24 7.06<br />
Vanguard Dividend Appreciation VIG 0.13 11,658.1 6.17 8.90 6.16 14.74 13.23 3.10 40,531.6 15.0 13.14 2.05<br />
SPDR DJ Industrial Average DIA 0.17 11,324.4 6.44 9.19 8.06 14.01 14.14 2.33 117,350.6 13.9 13.93 2.40<br />
iShares DJ Select Dividend DVY 0.40 10,966.2 5.13 8.31 11.81 17.79 16.81 0.23 11,780.2 15.5 12.04 3.41<br />
iShares S&P 400 MidCap IJH 0.21 10,796.3 5.42 11.63 -2.18 26.72 15.58 3.84 3,495.5 17.4 18.83 1.24<br />
Technology Select SPDR XLK 0.18 10,119.6 9.58 20.65 2.61 11.39 16.74 4.69 113,254.6 17.4 17.39 1.34<br />
iShares Gold Trust IAU 0.25 10,008.3 8.35 8.21 9.57 29.46 20.82 19.85 - - 20.26 -<br />
iShares S&P US Preferred Stock PFF 0.48 9,945.2 5.50 15.50 -2.00 13.81 12.08 4.24 - - 9.91 5.74<br />
Source: Morningstar. Data as of August 31, 2012. Exp Ratio is expense ratio. 3-Mo is 3-month. YTD is year-to-date. 3-Yr and 5-Yr are 3-year and 5-year annualized returns, respectively.<br />
Mkt Cap is geometric average market capitalization. P/E is price-to-earnings ratio. Std Dev is 3-year standard deviation. Yield is 12-month.<br />
62 November / December 2012


