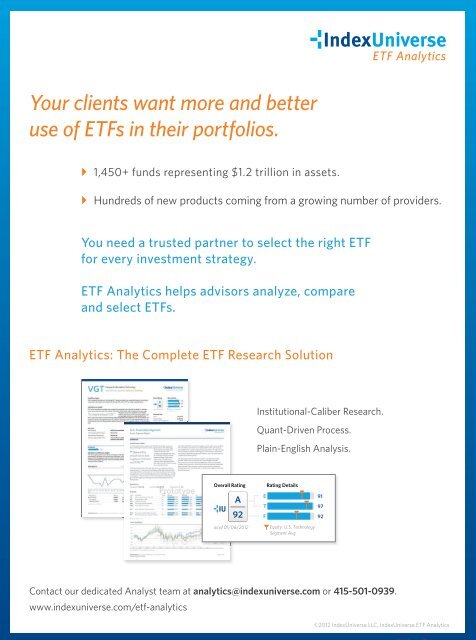
ETF Analytics Your clients want more and better use of ETFs in their portfolios. } 1,450+ funds representing $1.2 trillion in assets. } Hundreds of new products <strong>com</strong>ing from a growing number of providers. You need a trusted partner to select the right ETF for every investment strategy. ETF Analytics helps advisors analyze, <strong>com</strong>pare and select ETFs. ETF Analytics: The Complete ETF Research Solution Institutional-Caliber Research. Quant-Driven Process. Plain-English Analysis. Overall Rating A 92 as of 01/06/2012 Rating Details E 91 T 97 F 92 Equity: U.S. Technology Segment Avg Contact our dedicated Analyst team at analytics@indexuniverse.<strong>com</strong> or 415-501-0939. www.indexuniverse.<strong>com</strong>/etf-analytics ©2012 <strong>IndexUniverse</strong> LLC, <strong>IndexUniverse</strong> ETF Analytics
Arnott continued from page 51 <strong>com</strong>pany, with a remarkable history, but it’s often not a profitable prospective investment. The diminishing agility and flexibility as a <strong>com</strong>pany grows, the natural human tendency to punish the winners, the media coverage—arguably with a bias against the biggest winners—along with often-lofty starting valuation, all may contribute to our empirical evidence for subsequent disappointing results. Our previous studies suggested that top dog status is of no advantage in the United States; indeed, it’s often something of a curse. As we globalize this study, the results confirm the global relevance of “too big to succeed.” In the G-8 test of developed economies, we find the same phenomenon in each and every market: a statistically significant performance shortfall for top <strong>com</strong>panies, relative both to the <strong>com</strong>panies’ sectors and the stock market as a whole, with no countries immune to the effect. Less extensive tests for stocks from all 24 developed countries and the 12 largest-cap emerging markets confirms the effect. These tests also suggest that top dogs typically suffer a larger performance shortfall in the smaller developed and emerging economies outside the United States than in the United States. We see no indication that <strong>com</strong>panies that rise to the top of their sector can long continue to dominate their sector to an extent that would justify their often-lofty stock price. One sobering observation, for those who merely dismiss these top dog results as a direct consequence of the welldocumented size and value effects, is that our average top dog, whether a sector top dog or a national top dog, or a global top dog or an emerging markets top dog, historically delivers a return that is considerably lower than domestic cash yields. We know of no argument in neoclassical modern finance theory that supports a persistent negative equity risk premium for any category of stocks, including the top dogs. One simplistic solution would be to index, using whatever weighting scheme one chooses, but to omit either the largest-cap <strong>com</strong>pany in the country or the largest in each sector. While either rule would assuredly not work 100 percent of the time, the results are pretty jarring. Such a portfolio would win, over long periods of time, with statistical significance, in most markets around the world. Based on chance alone, we would expect to find many sector or national top dogs that can reliably outperform over long spans. We do not; they are barely more <strong>com</strong>mon than unicorns. Said another way, the very business practices that drive an enterprise to the top might not necessarily make the <strong>com</strong>pany a good investment. Bigger is not always better. A lightly edited version of this paper is available in the December/January <strong>issue</strong> of the European Financial Review. The two journals have agreed to joint publication. References Arnott, Robert D. 2005. “What Cost ‘Noise’?” Financial Analysts Journal, vol. 61, no. 2 (March/April):10-14. ———. 2010. “Too Big To Succeed.” Fundamentals (June). Arnott, Robert D., Feifei Li and Katrina Sherrerd. 2009a. “Clairvoyant Value and the Value Effect.” Journal of Portfolio Management, vol. 35, no. 3 (Spring):12-26. ———. 2009b. “Clairvoyant Value II: The Growth/Value Cycle.” Journal of Portfolio Management, vol. 35, no. 4 (Summer):142-157. Banz, Rolf W. 1981. “The Relationship Between Return and Market Value of Common Stocks.” Journal of Financial Economics, vol. 9, no. 1 (March):3-18. Basu, Sanjoy. 1977. “Investment Performance of Common Stocks in Relation to Their Price-Earnings Ratios: A Test of the Efficient Market Hypothesis.” Journal of Finance, vol. 32, no. 3 (June):663-682. ———. 1983. “The Relationship between Earnings Yield, Market Value and Return for NYSE Common Stocks: Further Evidence.” Journal of Finance, vol. 12, no. 1 (March):126-156. Chow, Tzee-Man, Jason Hsu, Vitali Kalesnik and Bryce Little. 2011. “A Survey of Alternative Equity Index Strategies.” Financial Analysts Journal, vol. 67, no. 5 (September/ October):37-57. Dreman, D. 1977. “Psychology and the Stock Market: Why the Pros Go Wrong and How to Profit.” New York: Random House. Fama, Eugene F., and Kenneth R. French. 1992. “The Cross-Section of Expected Stock Returns.” Journal of Finance, vol. 47, no. 2 (June):427–465. Fang, Lily, and Joel Peress. 2009. “Media Coverage and The Cross-Section of Stock Returns.” Journal of Finance, vol. 64, no. 5 (October):2023-2052. Lakonishok, Josef, Andrei Shleifer and Robert W. Vishny. 1994. “Contrarian Investment, Extrapolation, and Risk.” Journal of Finance, vol. 49, no. 5 (December):1541-1578. Milano, Gregory V. 2011. “Too Big to Succeed?” CFO (April 29): http://www.cfo.<strong>com</strong>/article.cfm/14572986/c_14573206 Endnotes 1 We could have used measures of economic footprint, popularized by the growing interest in the Fundamental Index® concept, such as sales, book value, profits, dividends, buybacks, number of employees, and so forth. Market capitalization is, of course, a product of economic footprint and valuation multiples. For instance, <strong>com</strong>pany sales times the price/sales ratio gives us market cap. So one might argue that we’re looking at a blend of <strong>com</strong>pany size and <strong>com</strong>pany popularity. Indeed, we are. For purposes of this paper, our “top dogs” are the <strong>com</strong>panies that—with very few exceptions—are both a dominant player within their business and popular enough to carry a premium multiple. If a <strong>com</strong>pany has the largest market cap in its sector (or country), this tacitly implies a consensus expectation that it will deliver larger profit distributions to its shareholders in future decades than any other <strong>com</strong>pany in its sector (or country). These <strong>com</strong>panies are also expected to continue to increase their dominance. 2 In the Tour de France bicycle race, the leader after each day’s race wears a yellow jersey the next day so that <strong>com</strong>petitors can recognize the leader from a distance. 3 Observers may sensibly suggest that a <strong>com</strong>pany with 51 percent market share can still double if its market doubles. Of course, growing the market helps <strong>com</strong>petitors in like proportion. 4 In countless empirical studies (e.g., see Chow et al. 2011), equal weighting tends to beat cap weighting by 1-2 percent per year. Equal- or cap-weighting will not change the basic findings in our research. It bears mention that we do not exclude the top dog from its own sector return or country return. So while some might argue that equalweighting our benchmarks will lead to a larger shortfall, we would counter that including our top dogs in the benchmarks will have the opposite effect. In any event, the top dog effects that we explore in this article are much more powerful than the effects of benchmark construction. 5 The 719 one-year samples were statistically independent, both cross sectionally and intertemporally. The 611 10-year samples were based on rolling 10-year results, so they are roughly equivalent to 60 independent samples. 6 Now that Apple has taken over at the top, we now have eight U.S. national top dogs in 61 years! 7 We also carry out additional tests on the sector top dogs for 24 developed economies; these are handled separately, because most of the 24 countries are much less diversified, with much stronger dominance by their top dogs than the G-8 primary countries that we tested. The data is “noisier,” with big outliers, so we <strong>com</strong>pile averages across these markets. Still, we are interested to test whether the “too big to succeed” story applies globally. 8 This index spans the 1,000 largest-cap stocks in the US market and the 1,000 largest-cap stocks in the Developed ex-US markets, hence <strong>com</strong>prising 2,000 stocks. We refer to this list as the “top 2,000,” although it’s actually the <strong>com</strong>bination of two top-1,000 lists. 9 We don’t show the sector results here. But they are impressive, albeit with considerable variability. 10 Even relying on the 12 countries with the largest average market cap, this leads to remarkable concentration in some years. As one example, for Russia in 1996, only four <strong>com</strong>panies ranked in the top 1,000 in the emerging markets, by market cap. In 1997 and 1999, only six made the cut. 11 For purposes of this paper, we ignore the 10-year results, as there are not even two independent samples. 64 November / December 2012