

Download complete issue - IndexUniverse.com
Download complete issue - IndexUniverse.com
Download complete issue - IndexUniverse.com

You also want an ePaper? Increase the reach of your titles
YUMPU automatically turns print PDFs into web optimized ePapers that Google loves.
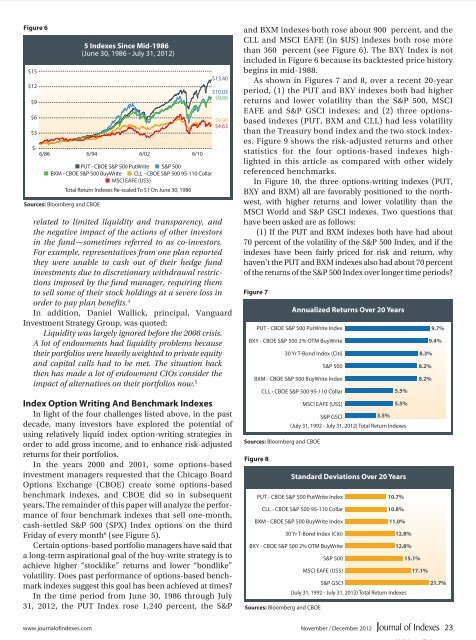
Figure 6<br />
$15<br />
$12<br />
$9<br />
$6<br />
$3<br />
5 Indexes Since Mid-1986<br />
(June 30, 1986 - July 31, 2012)<br />
$-<br />
6/86 6/94 6/02 6/10<br />
■ PUT - CBOE S&P 500 PutWrite ■ S&P 500<br />
■ BXM - CBOE S&P 500 BuyWrite ■ CLL - CBOE S&P 500 95-110 Collar<br />
■ MSCI EAFE (US$)<br />
Sources: Bloomberg and CBOE<br />
Total Return Indexes Re-scaled To $1 On June 30, 1986<br />
$13.40<br />
$10.03<br />
$9.86<br />
$4.90<br />
$4.63<br />
related to limited liquidity and transparency, and<br />
the negative impact of the actions of other investors<br />
in the fund—sometimes referred to as co-investors.<br />
For example, representatives from one plan reported<br />
they were unable to cash out of their hedge fund<br />
investments due to discretionary withdrawal restrictions<br />
imposed by the fund manager, requiring them<br />
to sell some of their stock holdings at a severe loss in<br />
order to pay plan benefits. 4<br />
In addition, Daniel Wallick, principal, Vanguard<br />
Investment Strategy Group, was quoted:<br />
Liquidity was largely ignored before the 2008 crisis.<br />
A lot of endowments had liquidity problems because<br />
their portfolios were heavily weighted to private equity<br />
and capital calls had to be met. The situation back<br />
then has made a lot of endowment CIOs consider the<br />
impact of alternatives on their portfolios now. 5<br />
Index Option Writing And Benchmark Indexes<br />
In light of the four challenges listed above, in the past<br />
decade, many investors have explored the potential of<br />
using relatively liquid index option-writing strategies in<br />
order to add gross in<strong>com</strong>e, and to enhance risk-adjusted<br />
returns for their portfolios.<br />
In the years 2000 and 2001, some options-based<br />
investment managers requested that the Chicago Board<br />
Options Exchange (CBOE) create some options-based<br />
benchmark indexes, and CBOE did so in subsequent<br />
years. The remainder of this paper will analyze the performance<br />
of four benchmark indexes that sell one-month,<br />
cash-settled S&P 500 (SPX) Index options on the third<br />
Friday of every month 6 (see Figure 5).<br />
Certain options-based portfolio managers have said that<br />
a long-term aspirational goal of the buy-write strategy is to<br />
achieve higher “stocklike” returns and lower “bondlike”<br />
volatility. Does past performance of options-based benchmark<br />
indexes suggest this goal has been achieved at times?<br />
In the time period from June 30, 1986 through July<br />
31, 2012, the PUT Index rose 1,240 percent, the S&P<br />
and BXM indexes both rose about 900 percent, and the<br />
CLL and MSCI EAFE (in $US) indexes both rose more<br />
than 360 percent (see Figure 6). The BXY Index is not<br />
included in Figure 6 because its backtested price history<br />
begins in mid-1988.<br />
As shown in Figures 7 and 8, over a recent 20-year<br />
period, (1) the PUT and BXY indexes both had higher<br />
returns and lower volatility than the S&P 500, MSCI<br />
EAFE and S&P GSCI indexes; and (2) three optionsbased<br />
indexes (PUT, BXM and CLL) had less volatility<br />
than the Treasury bond index and the two stock indexes.<br />
Figure 9 shows the risk-adjusted returns and other<br />
statistics for the four options-based indexes highlighted<br />
in this article as <strong>com</strong>pared with other widely<br />
referenced benchmarks.<br />
In Figure 10, the three options-writing indexes (PUT,<br />
BXY and BXM) all are favorably positioned to the northwest,<br />
with higher returns and lower volatility than the<br />
MSCI World and S&P GSCI indexes. Two questions that<br />
have been asked are as follows:<br />
(1) If the PUT and BXM indexes both have had about<br />
70 percent of the volatility of the S&P 500 Index, and if the<br />
indexes have been fairly priced for risk and return, why<br />
haven’t the PUT and BXM indexes also had about 70 percent<br />
of the returns of the S&P 500 Index over longer time periods?<br />
Figure 7<br />
PUT - CBOE S&P 500 PutWrite Index<br />
BXY - CBOE S&P 500 2% OTM BuyWrite<br />
30 Yr T-Bond Index (Citi)<br />
S&P 500<br />
BXM - CBOE S&P 500 BuyWrite Index<br />
CLL - CBOE S&P 500 95-110 Collar<br />
Sources: Bloomberg and CBOE<br />
Figure 8<br />
Annualized Returns Over 20 Years<br />
MSCI EAFE (US$)<br />
S&P GSCI<br />
(July 31, 1992 - July 31, 2012) Total Return Indexes<br />
PUT - CBOE S&P 500 PutWrite Index<br />
CLL - CBOE S&P 500 95-110 Collar<br />
BXM - CBOE S&P 500 BuyWrite Index<br />
30 Yr T-Bond Index (Citi)<br />
BXY - CBOE S&P 500 2% OTM BuyWrite<br />
Sources: Bloomberg and CBOE<br />
3.5%<br />
5.5%<br />
5.5%<br />
Standard Deviations Over 20 Years<br />
S&P 500<br />
MSCI EAFE (US$)<br />
S&P GSCI<br />
10.7%<br />
10.8%<br />
11.0%<br />
12.8%<br />
12.8%<br />
(July 31, 1992 - July 31, 2012) Total Return Indexes<br />
15.1%<br />
8.3%<br />
8.2%<br />
8.2%<br />
17.1%<br />
9.7%<br />
9.4%<br />
21.7%<br />
www.journalofindexes.<strong>com</strong> November / December 2012 23


