

Download complete issue - IndexUniverse.com
Download complete issue - IndexUniverse.com
Download complete issue - IndexUniverse.com

Create successful ePaper yourself
Turn your PDF publications into a flip-book with our unique Google optimized e-Paper software.
tor top dogs tends to persist for at least a decade, an investor<br />
might do even better by leaving out all of the <strong>com</strong>panies<br />
that have been sector leaders any time in the past 10 years.<br />
Looking At Emerging Markets<br />
Sector and national top dogs clearly fare badly across the<br />
developed world. But what of the ostensibly less-efficient<br />
emerging markets? The “top dog” effect should arguably be<br />
more powerful in less efficient or less developed markets. On<br />
the other hand, do the (typically) superb political connections<br />
of the emerging market top dogs with their respective nations’<br />
leadership insulate them from the “too big to succeed” syndrome?<br />
As we saw with Yukos in Russia—a particularly vivid<br />
example—political connections can cut both ways.<br />
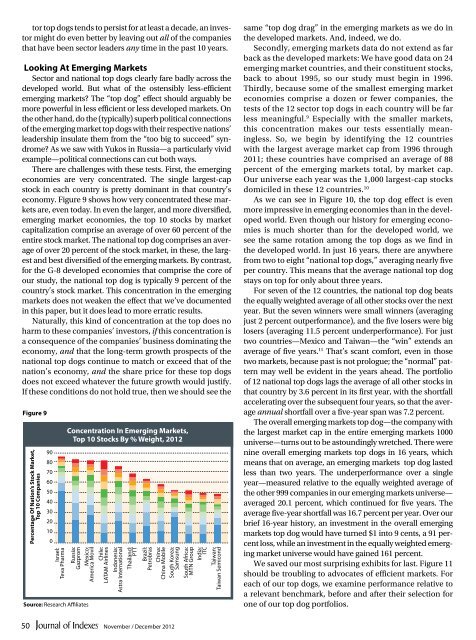
There are challenges with these tests. First, the emerging<br />
economies are very concentrated. The single largest-cap<br />
stock in each country is pretty dominant in that country’s<br />
economy. Figure 9 shows how very concentrated these markets<br />
are, even today. In even the larger, and more diversified,<br />
emerging market economies, the top 10 stocks by market<br />
capitalization <strong>com</strong>prise an average of over 60 percent of the<br />
entire stock market. The national top dog <strong>com</strong>prises an average<br />
of over 20 percent of the stock market, in these, the largest<br />
and best diversified of the emerging markets. By contrast,<br />
for the G-8 developed economies that <strong>com</strong>prise the core of<br />
our study, the national top dog is typically 9 percent of the<br />
country’s stock market. This concentration in the emerging<br />
markets does not weaken the effect that we’ve documented<br />
in this paper, but it does lead to more erratic results.<br />
Naturally, this kind of concentration at the top does no<br />
harm to these <strong>com</strong>panies’ investors, if this concentration is<br />
a consequence of the <strong>com</strong>panies’ business dominating the<br />
economy, and that the long-term growth prospects of the<br />
national top dogs continue to match or exceed that of the<br />
nation’s economy, and the share price for these top dogs<br />
does not exceed whatever the future growth would justify.<br />
If these conditions do not hold true, then we should see the<br />
Figure 9<br />
Percentage Of Nation’s Stock Market,<br />
Top 10 Companies<br />
90<br />
80<br />
70<br />
60<br />
50<br />
40<br />
30<br />
20<br />
10<br />
0<br />
Israel:<br />
Teva Pharma<br />
Russia:<br />
Gazprom<br />
Mexico:<br />
America Movil<br />
Source: Research Affiliates<br />
Concentration In Emerging Markets,<br />
Top 10 Stocks By % Weight, 2012<br />
Chile:<br />
LATAM Airlines<br />
Indonesia:<br />
Astra International<br />
Thailand:<br />
PTT<br />
Brazil:<br />
Petrobras<br />
China:<br />
China Mobile<br />
South Korea:<br />
Samsung<br />
South Africa:<br />
MTN Group<br />
India:<br />
ITC<br />
Taiwan:<br />
Taiwan Semicond<br />
same “top dog drag” in the emerging markets as we do in<br />
the developed markets. And, indeed, we do.<br />
Secondly, emerging markets data do not extend as far<br />
back as the developed markets: We have good data on 24<br />
emerging market countries, and their constituent stocks,<br />
back to about 1995, so our study must begin in 1996.<br />
Thirdly, because some of the smallest emerging market<br />
economies <strong>com</strong>prise a dozen or fewer <strong>com</strong>panies, the<br />
tests of the 12 sector top dogs in each country will be far<br />
less meaningful. 9 Especially with the smaller markets,<br />
this concentration makes our tests essentially meaningless.<br />
So, we begin by identifying the 12 countries<br />
with the largest average market cap from 1996 through<br />
2011; these countries have <strong>com</strong>prised an average of 88<br />
percent of the emerging markets total, by market cap.<br />
Our universe each year was the 1,000 largest-cap stocks<br />
domiciled in these 12 countries. 10<br />
As we can see in Figure 10, the top dog effect is even<br />
more impressive in emerging economies than in the developed<br />
world. Even though our history for emerging economies<br />
is much shorter than for the developed world, we<br />
see the same rotation among the top dogs as we find in<br />
the developed world. In just 16 years, there are anywhere<br />
from two to eight “national top dogs,” averaging nearly five<br />
per country. This means that the average national top dog<br />
stays on top for only about three years.<br />
For seven of the 12 countries, the national top dog beats<br />
the equally weighted average of all other stocks over the next<br />
year. But the seven winners were small winners (averaging<br />
just 2 percent outperformance), and the five losers were big<br />
losers (averaging 11.5 percent underperformance). For just<br />
two countries—Mexico and Taiwan—the “win” extends an<br />
average of five years. 11 That’s scant <strong>com</strong>fort, even in those<br />
two markets, because past is not prologue; the “normal” pattern<br />
may well be evident in the years ahead. The portfolio<br />
of 12 national top dogs lags the average of all other stocks in<br />
that country by 3.6 percent in its first year, with the shortfall<br />
accelerating over the subsequent four years, so that the average<br />
annual shortfall over a five-year span was 7.2 percent.<br />
The overall emerging markets top dog—the <strong>com</strong>pany with<br />
the largest market cap in the entire emerging markets 1000<br />
universe—turns out to be astoundingly wretched. There were<br />
nine overall emerging markets top dogs in 16 years, which<br />
means that on average, an emerging markets top dog lasted<br />
less than two years. The underperformance over a single<br />
year—measured relative to the equally weighted average of<br />
the other 999 <strong>com</strong>panies in our emerging markets universe—<br />
averaged 20.1 percent, which continued for five years. The<br />
average five-year shortfall was 16.7 percent per year. Over our<br />
brief 16-year history, an investment in the overall emerging<br />
markets top dog would have turned $1 into 9 cents, a 91 percent<br />
loss, while an investment in the equally weighted emerging<br />
market universe would have gained 161 percent.<br />
We saved our most surprising exhibits for last. Figure 11<br />
should be troubling to advocates of efficient markets. For<br />
each of our top dogs, we examine performance relative to<br />
a relevant benchmark, before and after their selection for<br />
one of our top dog portfolios.<br />
50<br />
November / December 2012


