

Download complete issue - IndexUniverse.com
Download complete issue - IndexUniverse.com
Download complete issue - IndexUniverse.com

Create successful ePaper yourself
Turn your PDF publications into a flip-book with our unique Google optimized e-Paper software.
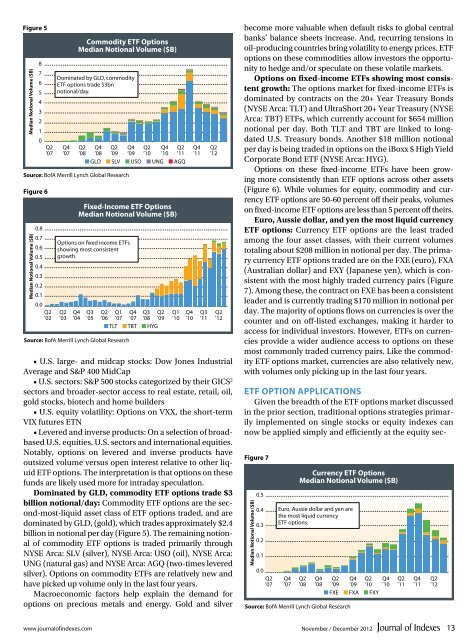
Figure 5<br />
Median notional Volume ($B)<br />
8<br />
7<br />
6<br />
5<br />
4<br />
3<br />
2<br />
1<br />
0<br />
Q2<br />
’07<br />
Q4<br />
’07<br />
<strong>com</strong>modity ETF Options<br />
Median notional Volume ($B)<br />
Dominated by GLD, <strong>com</strong>modity<br />
ETF options trade $3bn<br />
notional/day.<br />
Q2<br />
’08<br />
Q4<br />
’08<br />
Q2<br />
’09<br />
Q4<br />
’09<br />
Q2<br />
’10<br />
■ GLD ■ SLV ■ USO ■ UNG<br />
Source: BofA Merrill Lynch Global Research<br />
Figure 6<br />
Median notional Volume ($B)<br />
0.8<br />
0.7<br />
0.6<br />
0.5<br />
0.4<br />
0.3<br />
0.2<br />
0.1<br />
0.0<br />
Q2<br />
’02<br />
Q2<br />
’03<br />
Q4<br />
’04<br />
Source: BofA Merrill Lynch Global Research<br />
Q4<br />
’10<br />
Q2<br />
’11<br />
■ AGQ<br />
Fixed-in<strong>com</strong>e ETF Options<br />
Median notional Volume ($B)<br />
Options on fixed in<strong>com</strong>e ETFs<br />
showing most consistent<br />
growth.<br />
Q3<br />
’05<br />
Q2<br />
’06<br />
Q1<br />
’07<br />
Q4<br />
’07<br />
Q3<br />
’08<br />
Q2<br />
’09<br />
■ TLT ■ TBT ■ HYG<br />
Q1<br />
’10<br />
Q4<br />
’10<br />
Q4<br />
’11<br />
Q3<br />
’11<br />
Q2<br />
’12<br />
Q2<br />
’12<br />
• U.S. large- and midcap stocks: Dow Jones Industrial<br />
Average and S&P 400 MidCap<br />
• U.S. sectors: S&P 500 stocks categorized by their GICS 2<br />
sectors and broader-sector access to real estate, retail, oil,<br />
gold stocks, biotech and home builders<br />
• U.S. equity volatility: Options on VXX, the short-term<br />
VIX futures ETN<br />
• Levered and inverse products: On a selection of broadbased<br />
U.S. equities, U.S. sectors and international equities.<br />
Notably, options on levered and inverse products have<br />
outsized volume versus open interest relative to other liquid<br />
ETF options. The interpretation is that options on these<br />
funds are likely used more for intraday speculation.<br />
Dominated by GLD, <strong>com</strong>modity ETF options trade $3<br />
billion notional/day: Commodity ETF options are the second-most-liquid<br />
asset class of ETF options traded, and are<br />
dominated by GLD, (gold), which trades approximately $2.4<br />
billion in notional per day (Figure 5). The remaining notional<br />
of <strong>com</strong>modity ETF options is traded primarily through<br />
NYSE Arca: SLV (silver), NYSE Arca: USO (oil), NYSE Arca:<br />
UNG (natural gas) and NYSE Arca: AGQ (two-times levered<br />
silver). Options on <strong>com</strong>modity ETFs are relatively new and<br />
have picked up volume only in the last four years.<br />
Macroeconomic factors help explain the demand for<br />
options on precious metals and energy. Gold and silver<br />
be<strong>com</strong>e more valuable when default risks to global central<br />
banks’ balance sheets increase. And, recurring tensions in<br />
oil-producing countries bring volatility to energy prices. ETF<br />
options on these <strong>com</strong>modities allow investors the opportunity<br />
to hedge and/or speculate on these volatile markets.<br />
Options on fixed-in<strong>com</strong>e ETFs showing most consistent<br />
growth: The options market for fixed-in<strong>com</strong>e ETFs is<br />
dominated by contracts on the 20+ Year Treasury Bonds<br />
(NYSE Arca: TLT) and UltraShort 20+ Year Treasury (NYSE<br />
Arca: TBT) ETFs, which currently account for $654 million<br />
notional per day. Both TLT and TBT are linked to longdated<br />
U.S. Treasury bonds. Another $18 million notional<br />
per day is being traded in options on the iBoxx $ High Yield<br />
Corporate Bond ETF (NYSE Arca: HYG).<br />
Options on these fixed-in<strong>com</strong>e ETFs have been growing<br />
more consistently than ETF options across other assets<br />
(Figure 6). While volumes for equity, <strong>com</strong>modity and currency<br />
ETF options are 50-60 percent off their peaks, volumes<br />
on fixed-in<strong>com</strong>e ETF options are less than 5 percent off theirs.<br />
Euro, Aussie dollar, and yen the most liquid currency<br />
ETF options: Currency ETF options are the least traded<br />
among the four asset classes, with their current volumes<br />
totaling about $208 million in notional per day. The primary<br />
currency ETF options traded are on the FXE (euro), FXA<br />
(Australian dollar) and FXY (Japanese yen), which is consistent<br />
with the most highly traded currency pairs (Figure<br />
7). Among these, the contract on FXE has been a consistent<br />
leader and is currently trading $170 million in notional per<br />
day. The majority of options flows on currencies is over the<br />
counter and on off-listed exchanges, making it harder to<br />
access for individual investors. However, ETFs on currencies<br />
provide a wider audience access to options on these<br />
most <strong>com</strong>monly traded currency pairs. Like the <strong>com</strong>modity<br />
ETF options market, currencies are also relatively new,<br />
with volumes only picking up in the last four years.<br />
ETF Option Applications<br />
Given the breadth of the ETF options market discussed<br />
in the prior section, traditional options strategies primarily<br />
implemented on single stocks or equity indexes can<br />
now be applied simply and efficiently at the equity sec-<br />
Figure 7<br />
Median notional Volume ($B)<br />
0.5<br />
0.4<br />
0.3<br />
0.2<br />
0.1<br />
0.0<br />
Q2<br />
’07<br />
Q4<br />
’07<br />
currency ETF Options<br />
Median notional Volume ($B)<br />
Euro, Aussie dollar and yen are<br />
the most liquid currency<br />
ETF options.<br />
Q2<br />
’08<br />
Q4<br />
’08<br />
Q2<br />
’09<br />
Q4<br />
’09<br />
Q2<br />
’10<br />
■ FXE ■ FXA ■ FXY<br />
Source: BofA Merrill Lynch Global Research<br />
Q4<br />
’10<br />
Q2<br />
’11<br />
Q4<br />
’11<br />
Q2<br />
’12<br />
www.journalofindexes.<strong>com</strong> November / December 2012<br />
13


