

Download complete issue - IndexUniverse.com
Download complete issue - IndexUniverse.com
Download complete issue - IndexUniverse.com

Create successful ePaper yourself
Turn your PDF publications into a flip-book with our unique Google optimized e-Paper software.
States, the average concentration puts 17 percent of our capweighted<br />
dollars into the single largest-cap <strong>com</strong>pany.<br />
National top dogs naturally dominate their country<br />
market less than the sector top dogs dominate their country-specific<br />
sectors. On average, in the United States, the<br />
national top dog <strong>com</strong>prises 3 percent of the entire U.S.<br />
stock market. In other countries, the indexes are more<br />
reliant on their top dogs than that in the United States;<br />
only Japan shows concentration similar to the United<br />
States. For most countries, the concentration is two to<br />
three times as great. In the G-8 developed economies in<br />
this study, the largest single stock <strong>com</strong>prises an average<br />
of 7 percent of the country index, and the sector top dogs<br />
<strong>com</strong>prise an average of 34 percent of their own sector.<br />
Figure 6<br />
Comparative Performance Of Developed-Market<br />
Top Dogs, Against Broad Market, CW And EW, 1981-2011<br />
32.00<br />
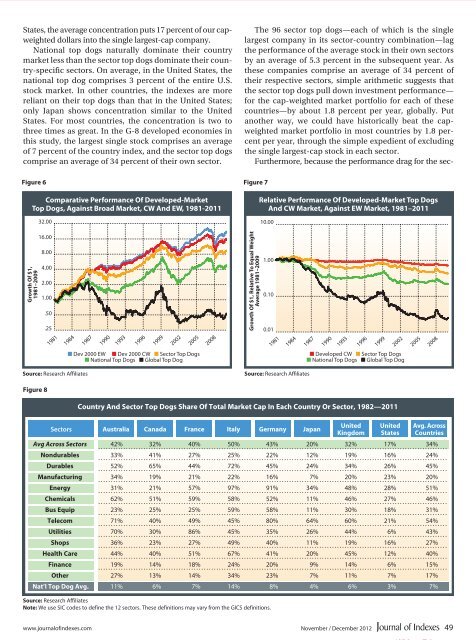
The 96 sector top dogs—each of which is the single<br />
largest <strong>com</strong>pany in its sector-country <strong>com</strong>bination—lag<br />
the performance of the average stock in their own sectors<br />
by an average of 5.3 percent in the subsequent year. As<br />
these <strong>com</strong>panies <strong>com</strong>prise an average of 34 percent of<br />
their respective sectors, simple arithmetic suggests that<br />
the sector top dogs pull down investment performance—<br />
for the cap-weighted market portfolio for each of these<br />
countries—by about 1.8 percent per year, globally. Put<br />
another way, we could have historically beat the capweighted<br />
market portfolio in most countries by 1.8 percent<br />
per year, through the simple expedient of excluding<br />
the single largest-cap stock in each sector.<br />
Furthermore, because the performance drag for the sec-<br />
Figure 7<br />
Relative Performance Of Developed-Market Top Dogs<br />
And CW Market, Against EW Market, 1981–2011<br />
10.00<br />
Growth Of $1,<br />
1981–2009<br />
16.00<br />
8.00<br />
4.00<br />
2.00<br />
1.00<br />
.50<br />
.25<br />
1981<br />
1984<br />
1987<br />
1990<br />
1993<br />
1996<br />
1999<br />
2002<br />
2005<br />
2008<br />
Growth Of $1, Relative To Equal Weight<br />
Average 1981–2009<br />
1.00<br />
0.10<br />
0.01<br />
1981<br />
1984<br />
1987<br />
1990<br />
1993<br />
1996<br />
1999<br />
2002<br />
2005<br />
2008<br />
■ Dev 2000 EW ■ Dev 2000 CW ■ Sector Top Dogs<br />
■ National Top Dogs ■ Global Top Dog<br />
■ Developed CW ■ Sector Top Dogs<br />
■ National Top Dogs ■ Global Top Dog<br />
Source: Research Afliates<br />
Source: Research Afliates<br />
Figure 8<br />
Country And Sector Top Dogs Share Of Total Market Cap In Each Country Or Sector, 1982 —2011<br />
Sectors Australia Canada France Italy Germany Japan<br />
Source: Research Affiliates<br />
Note: We use SIC codes to define the 12 sectors. These definitions may vary from the GICS definitions.<br />
United<br />
Kingdom<br />
United<br />
States<br />
Avg. Across<br />
Countries<br />
Avg Across Sectors 42% 32% 40% 50% 43% 20% 32% 17% 34%<br />
Nondurables 33% 41% 27% 25% 22% 12% 19% 16% 24%<br />
Durables 52% 65% 44% 72% 45% 24% 34% 26% 45%<br />
Manufacturing 34% 19% 21% 22% 16% 7% 20% 23% 20%<br />
Energy 31% 21% 57% 97% 91% 34% 48% 28% 51%<br />
Chemicals 62% 51% 59% 58% 52% 11% 46% 27% 46%<br />
Bus Equip 23% 25% 25% 59% 58% 11% 30% 18% 31%<br />
Tele<strong>com</strong> 71% 40% 49% 45% 80% 64% 60% 21% 54%<br />
Utilities 70% 30% 86% 45% 35% 26% 44% 6% 43%<br />
Shops 36% 23% 27% 49% 40% 11% 19% 16% 27%<br />
Health Care 44% 40% 51% 67% 41% 20% 45% 12% 40%<br />
Finance 19% 14% 18% 24% 20% 9% 14% 6% 15%<br />
Other 27% 13% 14% 34% 23% 7% 11% 7% 17%<br />
Nat’l Top Dog Avg. 11% 6% 7% 14% 8% 4% 6% 3% 7%<br />
www.journalofindexes.<strong>com</strong><br />
November / December 2012 49


