

Download complete issue - IndexUniverse.com
Download complete issue - IndexUniverse.com
Download complete issue - IndexUniverse.com

You also want an ePaper? Increase the reach of your titles
YUMPU automatically turns print PDFs into web optimized ePapers that Google loves.
• -0.70 for the S&P 500 VIX Mid-term Futures Index<br />
(SPVIXMTR)<br />
• -0.63 for the S&P 500 Dynamic VIX Futures Index<br />
(SPDVIXT)<br />
• -0.60 for the S&P 500 VIX Futures Tail Risk Index – Short<br />
Term (SPVXTRST)<br />
Some investors who are exploring the possibility of using index options<br />
have asked the question, Do the index options markets have<br />
the capacity and liquidity to handle large influxes of new institutional<br />
funds that will be dedicated to options-based strategies?<br />
While the negative correlation of the VIX to many traditional<br />
investments can make the VIX appear to be attractive,<br />
the VIX is an index that is considered not investable.<br />
Exhibit K of a paper by Asset Consulting Group, “Key Tools<br />
for Hedging and Tail Risk Management” (February 2012)<br />
showed the correlations of weekly returns of various indexes<br />
in the period from April 7, 2006 through Feb. 3, 2012.<br />
Listed below are the negative correlations versus the S&P<br />
500 Index for three indexes that use VIX futures and are<br />
designed to reflect approximate investable performance<br />
(however, no index is considered 100 percent investable<br />
with no tracking error or transaction costs). 9<br />
Figure 14<br />
Figure 15<br />
Notional value, in $millions<br />
S&P 500 1.00<br />
Sources: Bloomberg and CBOE<br />
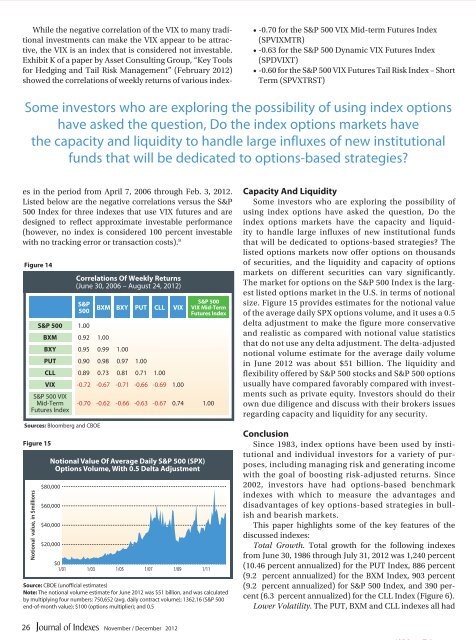
Notional Value Of Average Daily S&P 500 (SPX)<br />
Options Volume, With 0.5 Delta Adjustment<br />
$80,000<br />
$60,000<br />
$40,000<br />
$20,000<br />
Correlations Of Weekly Returns<br />
(June 30, 2006 – August 24, 2012)<br />
BXM 0.92 1.00<br />
S&P<br />
500 BXM BXY PUT CLL VIX S&P 500<br />
VIX Mid-Term<br />
Futures Index<br />
BXY 0.95 0.99 1.00<br />
PUT 0.90 0.98 0.97 1.00<br />
CLL 0.89 0.73 0.81 0.71 1.00<br />
VIX -0.72 -0.67 -0.71 -0.66 -0.69 1.00<br />
S&P 500 VIX<br />
Mid-Term -0.70 -0.62 -0.66 -0.63 -0.67 0.74 1.00<br />
Futures Index<br />
$0<br />
1/01 1/03 1/05 1/07 1/09 1/11<br />
Source: CBOE (unofficial estimates)<br />
Note: The notional volume estimate for June 2012 was $51 billion, and was calculated<br />
by multiplying four numbers: 750,652 (avg. daily contract volume); 1362.16 (S&P 500<br />
end-of-month value); $100 (options multiplier); and 0.5<br />
Capacity And Liquidity<br />
Some investors who are exploring the possibility of<br />
using index options have asked the question, Do the<br />
index options markets have the capacity and liquidity<br />
to handle large influxes of new institutional funds<br />
that will be dedicated to options-based strategies? The<br />
listed options markets now offer options on thousands<br />
of securities, and the liquidity and capacity of options<br />
markets on different securities can vary significantly.<br />
The market for options on the S&P 500 Index is the largest<br />
listed options market in the U.S. in terms of notional<br />
size. Figure 15 provides estimates for the notional value<br />
of the average daily SPX options volume, and it uses a 0.5<br />
delta adjustment to make the figure more conservative<br />
and realistic as <strong>com</strong>pared with notional value statistics<br />
that do not use any delta adjustment. The delta-adjusted<br />
notional volume estimate for the average daily volume<br />
in June 2012 was about $51 billion. The liquidity and<br />
flexibility offered by S&P 500 stocks and S&P 500 options<br />
usually have <strong>com</strong>pared favorably <strong>com</strong>pared with investments<br />
such as private equity. Investors should do their<br />
own due diligence and discuss with their brokers <strong>issue</strong>s<br />
regarding capacity and liquidity for any security.<br />
Conclusion<br />
Since 1983, index options have been used by institutional<br />
and individual investors for a variety of purposes,<br />
including managing risk and generating in<strong>com</strong>e<br />
with the goal of boosting risk-adjusted returns. Since<br />
2002, investors have had options-based benchmark<br />
indexes with which to measure the advantages and<br />
disadvantages of key options-based strategies in bullish<br />
and bearish markets.<br />
This paper highlights some of the key features of the<br />
discussed indexes:<br />
Total Growth. Total growth for the following indexes<br />
from June 30, 1986 through July 31, 2012 was 1,240 percent<br />
(10.46 percent annualized) for the PUT Index, 886 percent<br />
(9.2 percent annualized) for the BXM Index, 903 percent<br />
(9.2 percent annualized) for S&P 500 Index, and 390 percent<br />
(6.3 percent annualized) for the CLL Index (Figure 6).<br />
Lower Volatility. The PUT, BXM and CLL indexes all had<br />
26<br />
November / December 2012


