

Download complete issue - IndexUniverse.com
Download complete issue - IndexUniverse.com
Download complete issue - IndexUniverse.com

You also want an ePaper? Increase the reach of your titles
YUMPU automatically turns print PDFs into web optimized ePapers that Google loves.
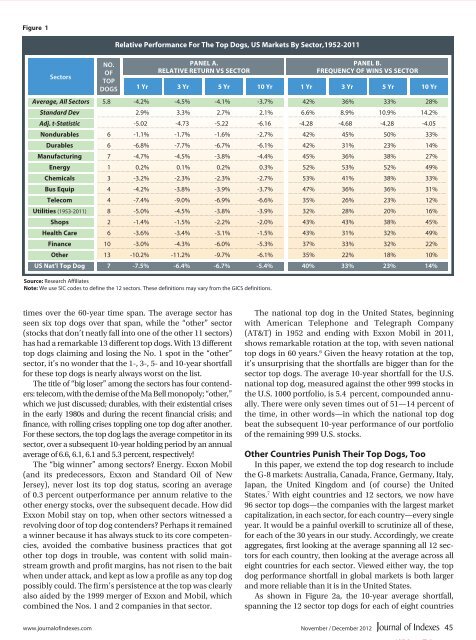
Figure 1<br />
sectors<br />
No.<br />
of<br />
top<br />
dogs<br />
Relative Performance For The Top Dogs, US Markets By Sector,1952-2011<br />
PaNel a.<br />
RelaTIVe ReTURN VS SeCTOR<br />
1 Yr 3 Yr 5 Yr 10 Yr 1 Yr<br />
3 Yr<br />
5 Yr<br />
10 Yr<br />
Source: Research Affiliates<br />
Note: We use SIC codes to define the 12 sectors. These definitions may vary from the GICS definitions.<br />
PaNel B.<br />
FReQUeNCY OF WINS VS SeCTOR<br />
Average, All Sectors 5.8 -4.2% -4.5% -4.1% -3.7% 42% 36% 33% 28%<br />
Standard Dev 2.9% 3.3% 2.7% 2.1% 6.6% 8.9% 10.9% 14.2%<br />
Adj. t-Statistic -5.02 -4.73 -5.22 -6.16 -4.28 -4.68 -4.28 -4.05<br />
Nondurables 6 -1.1% -1.7% -1.6% -2.7% 42% 45% 50% 33%<br />
Durables 6 -6.8% -7.7% -6.7% -6.1% 42% 31% 23% 14%<br />
Manufacturing 7 -4.7% -4.5% -3.8% -4.4% 45% 36% 38% 27%<br />
energy 1 0.2% 0.1% 0.2% 0.3% 52% 53% 52% 49%<br />
Chemicals 3 -3.2% -2.3% -2.3% -2.7% 53% 41% 38% 33%<br />
Bus equip 4 -4.2% -3.8% -3.9% -3.7% 47% 36% 36% 31%<br />
Tele<strong>com</strong> 4 -7.4% -9.0% -6.9% -6.6% 35% 26% 23% 12%<br />
Utilities (1953-2011) 8 -5.0% -4.5% -3.8% -3.9% 32% 28% 20% 16%<br />
Shops 2 -1.4% -1.5% -2.2% -2.0% 43% 43% 38% 45%<br />
Health Care 6 -3.6% -3.4% -3.1% -1.5% 43% 31% 32% 49%<br />
Finance 10 -3.0% -4.3% -6.0% -5.3% 37% 33% 32% 22%<br />
Other 13 -10.2% -11.2% -9.7% -6.1% 35% 22% 18% 10%<br />
US Nat’l Top Dog 7 -7.5% -6.4% -6.7% -5.4% 40% 33% 23% 14%<br />
times over the 60-year time span. The average sector has<br />
seen six top dogs over that span, while the “other” sector<br />
(stocks that don’t neatly fall into one of the other 11 sectors)<br />
has had a remarkable 13 different top dogs. With 13 different<br />
top dogs claiming and losing the No. 1 spot in the “other”<br />
sector, it’s no wonder that the 1-, 3-, 5- and 10-year shortfall<br />
for these top dogs is nearly always worst on the list.<br />
The title of “big loser” among the sectors has four contenders:<br />
tele<strong>com</strong>, with the demise of the Ma Bell monopoly; “other,”<br />
which we just discussed; durables, with their existential crises<br />
in the early 1980s and during the recent financial crisis; and<br />
finance, with rolling crises toppling one top dog after another.<br />
For these sectors, the top dog lags the average <strong>com</strong>petitor in its<br />
sector, over a subsequent 10-year holding period by an annual<br />
average of 6.6, 6.1, 6.1 and 5.3 percent, respectively!<br />
The “big winner” among sectors? Energy. Exxon Mobil<br />
(and its predecessors, Exxon and Standard Oil of New<br />
Jersey), never lost its top dog status, scoring an average<br />
of 0.3 percent outperformance per annum relative to the<br />
other energy stocks, over the subsequent decade. How did<br />
Exxon Mobil stay on top, when other sectors witnessed a<br />
revolving door of top dog contenders? Perhaps it remained<br />
a winner because it has always stuck to its core <strong>com</strong>petencies,<br />
avoided the <strong>com</strong>bative business practices that got<br />
other top dogs in trouble, was content with solid mainstream<br />
growth and profit margins, has not risen to the bait<br />
when under attack, and kept as low a profile as any top dog<br />
possibly could. The firm’s persistence at the top was clearly<br />
also aided by the 1999 merger of Exxon and Mobil, which<br />
<strong>com</strong>bined the Nos. 1 and 2 <strong>com</strong>panies in that sector.<br />
www.journalofindexes.<strong>com</strong><br />
The national top dog in the United States, beginning<br />
with American Telephone and Telegraph Company<br />
(AT&T) in 1952 and ending with Exxon Mobil in 2011,<br />
shows remarkable rotation at the top, with seven national<br />
top dogs in 60 years. 6 Given the heavy rotation at the top,<br />
it’s unsurprising that the shortfalls are bigger than for the<br />
sector top dogs. The average 10-year shortfall for the U.S.<br />
national top dog, measured against the other 999 stocks in<br />
the U.S. 1000 portfolio, is 5.4 percent, <strong>com</strong>pounded annually.<br />
There were only seven times out of 51—14 percent of<br />
the time, in other words—in which the national top dog<br />
beat the subsequent 10-year performance of our portfolio<br />
of the remaining 999 U.S. stocks.<br />
Other Countries Punish Their Top Dogs, Too<br />
In this paper, we extend the top dog research to include<br />
the G-8 markets: Australia, Canada, France, Germany, Italy,<br />
Japan, the United Kingdom and (of course) the United<br />
States. 7 With eight countries and 12 sectors, we now have<br />
96 sector top dogs—the <strong>com</strong>panies with the largest market<br />
capitalization, in each sector, for each country—every single<br />
year. It would be a painful overkill to scrutinize all of these,<br />
for each of the 30 years in our study. Accordingly, we create<br />
aggregates, first looking at the average spanning all 12 sectors<br />
for each country, then looking at the average across all<br />
eight countries for each sector. Viewed either way, the top<br />
dog performance shortfall in global markets is both larger<br />
and more reliable than it is in the United States.<br />
As shown in Figure 2a, the 10-year average shortfall,<br />
spanning the 12 sector top dogs for each of eight countries<br />
November / December 2012 45


