

Download complete issue - IndexUniverse.com
Download complete issue - IndexUniverse.com
Download complete issue - IndexUniverse.com

You also want an ePaper? Increase the reach of your titles
YUMPU automatically turns print PDFs into web optimized ePapers that Google loves.
Figure 9<br />
Metrics for Returns, Risk and Risk-Adjusted Returns (June 30, 1988 - July 31, 2012)<br />
BXM BXY PUT CLL<br />
S&P<br />
500<br />
MSCI<br />
EAFE<br />
30-Year<br />
Treasury<br />
Barclays<br />
US Agg<br />
Return 9.44% 10.56% 10.82% 6.14% 9.35% 4.38% 8.86% 7.29%<br />
Standard Deviation 10.63% 12.45% 10.12% 10.77% 14.97% 17.84% 12.29% 3.81%<br />
Beta vs. Market 0.63 0.78 0.56 0.66 1.00 0.87 -0.07 0.04<br />
Skewness -1.31 -0.92 -2.00 -0.13 -0.57 -0.40 0.24 -0.25<br />
Kurtosis 4.61 2.57 9.07 -0.29 1.08 0.90 3.33 0.58<br />
Sharpe Ratio 0.57 0.58 0.72 0.27 0.43 0.13 0.46 0.93<br />
Semi Standard Deviation 0.09 0.10 0.08 0.08 0.11 0.13 0.09 0.03<br />
Sortino Ratio (MAR = Cash Eq.) 0.72 0.79 0.90 0.36 0.59 0.15 0.69 1.38<br />
Jensen’s Alpha vs. S&P 0.02 0.02 0.04 -0.01 0.00 -0.03 0.06 0.03<br />
Source: Ibbotson & Associates<br />
Note: The BXM, BXY and PUT indexes had risk-adjusted performance that was superior to that of the S&P 500 per metrics such as the Sortino ratio, Sharpe ratio and Jensen’s<br />
alpha. Most of the above indexes had negative skewness, and the measures of risk-adjusted returns are imperfect when measuring non-normal distributions.<br />
(2) Why were the risk-adjusted returns of the CLL (collar)<br />
index so much weaker than the other three optionsbased<br />
indexes (PUT, BXM and BXY)?<br />
Source Of Strong Risk-Adjusted Returns:<br />
S&P 500 Options Have Been Richly Priced<br />
One answer to the two questions posed above is that<br />
one can look at Figure 11 and the <strong>com</strong>parison of implied<br />
500 95-110 Collar Index (CLL) has not had relatively strong<br />
risk-adjusted returns because of the fact that the CLL<br />
Index is both a buyer of (richly priced) put options and a<br />
seller of (richly priced) call options.<br />
As interest rates for U.S. fixed in<strong>com</strong>e have declined,<br />
investors continue to search for instruments with higher<br />
yields. A yield-based strategy that has grown in popularity<br />
over the past decade is the “buy-write” strategy,<br />
A yield-based strategy that has grown in popularity<br />
over the past decade is the “buy-write” strategy,<br />
in which an investor could buy securities and write<br />
(or sell) options on those strategies.<br />
and realized volatility. If the markets were very efficiently<br />
priced, one could expect that there would be little to no<br />
difference between the implied and realized volatility over<br />
the long term. However, the average difference in Figure<br />
11 was about 3.8 volatility points, a substantial number.<br />
Several other studies 7 also have found significant differences<br />
between implied and realized volatility.<br />
Why has there been a difference between implied and<br />
realized volatility? Professor Robert Whaley wrote:<br />
… there is excess buying pressure on S&P 500 index<br />
puts by portfolio insurers. Since there are no natural<br />
counterparties to these trades, market makers must step<br />
in to absorb the imbalance. … implied volatility will<br />
rise relative to actual return volatility. … The implied<br />
volatilities of the corresponding calls also rise from the<br />
reverse conversion arbitrage supporting put-call parity. 8<br />
While the three indexes that incorporate option selling<br />
(PUT, BXM and BXY) into their methodologies appear to<br />
have benefited from the fact that implied volatility usually<br />
has been higher than realized volatility, the CBOE S&P<br />
in which an investor could buy securities and write (or<br />
sell) options on those securities. The most well-known<br />
benchmark for the buy-write strategy—the CBOE S&P<br />
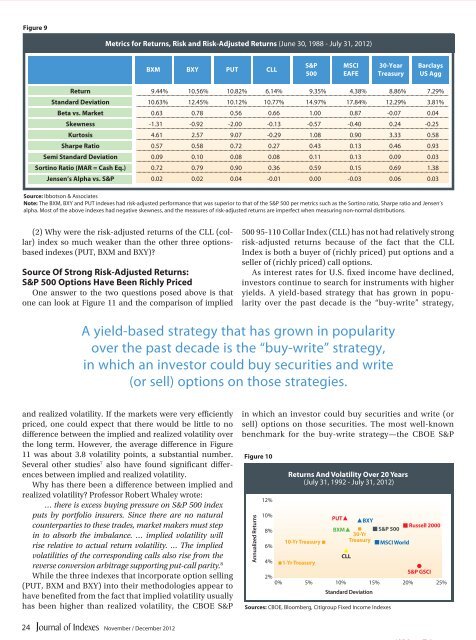
Figure 10<br />
Annualized Returns<br />
12%<br />
10%<br />
8%<br />
6%<br />
4%<br />
Returns And Volatility Over 20 Years<br />
(July 31, 1992 - July 31, 2012)<br />
10-Yr Treasury<br />
1-Yr Treasury<br />
PUT<br />
BXM<br />
CLL<br />
BXY<br />
30-Yr<br />
Treasury<br />
S&P GSCI<br />
2%<br />
0% 5% 10% 15% 20% 25%<br />
Standard Deviation<br />
S&P 500<br />
Sources: CBOE, Bloomberg, Citigroup Fixed In<strong>com</strong>e Indexes<br />
MSCI World<br />
Russell 2000<br />
24<br />
November / December 2012


