Supporting Document - Attachment 2 - Summary Dashboards - IPART
Supporting Document - Attachment 2 - Summary Dashboards - IPART
Supporting Document - Attachment 2 - Summary Dashboards - IPART

Create successful ePaper yourself
Turn your PDF publications into a flip-book with our unique Google optimized e-Paper software.
ATTACHMENT 2<br />
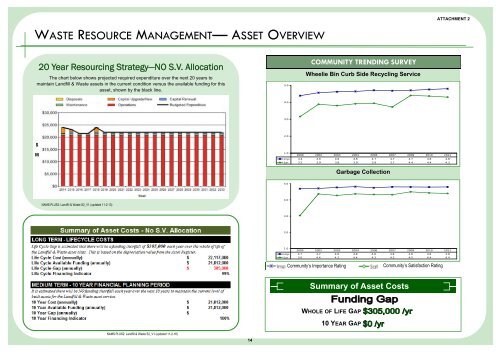
WASTE RESOURCE MANAGEMENT— ASSET OVERVIEW<br />
20 Year Resourcing Strategy—NO S.V. Allocation<br />
The chart below shows projected required expenditure over the next 20 years to<br />
maintain Landfill & Waste assets in the current condition versus the available funding for this<br />
asset, shown by the black line.<br />
5.0<br />
COMMUNITY TRENDING SURVEY<br />
Wheelie Bin Curb Side Recycling Service<br />
4.0<br />
3.0<br />
2.0<br />
$<br />
M<br />
1.0<br />
2000 2002 2003 2004 2006 2007 2009 2010 2011<br />
Imp 4.4 4.6 4.6 4.6 4.7 4.7 4.7 4.8 4.8<br />
Sat 3.2 3.9 3.8 3.9 3.9 3.7 4.4 4.4 4.3<br />
Garbage Collection<br />
5.0<br />
NAMS.PLUS2: Landfill & Waste S2_V1 (updated 11-2-13)<br />
4.0<br />
3.0<br />
2.0<br />
1.0<br />
2000 2002 2003 2004 2006 2007 2009 2010 2011<br />
Imp 4.7 4.7 4.8 4.8 4.8 4.8 4.8 4.8 4.8<br />
Sat 3.0 4.4 4.3 4.4 4.3 4.3 4.5 4.4 4.4<br />
Community’s Importance Rating<br />
Community’s Satisfaction Rating<br />
<strong>Summary</strong> of Asset Costs<br />
WHOLE OF LIFE GAP<br />
10 YEAR GAP<br />
NAMS.PLUS2: Landfill & Waste S2_V1 (updated 11-2-18)<br />
14