Supporting Document - Attachment 2 - Summary Dashboards - IPART
Supporting Document - Attachment 2 - Summary Dashboards - IPART
Supporting Document - Attachment 2 - Summary Dashboards - IPART

Create successful ePaper yourself
Turn your PDF publications into a flip-book with our unique Google optimized e-Paper software.
ATTACHMENT 2<br />
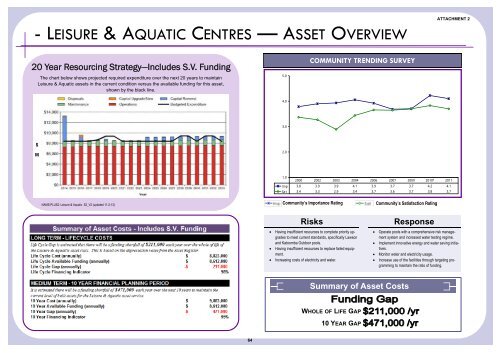
- LEISURE & AQUATIC CENTRES — ASSET OVERVIEW<br />
20 Year Resourcing Strategy—Includes S.V. Funding<br />
COMMUNITY TRENDING SURVEY<br />
The chart below shows projected required expenditure over the next 20 years to maintain<br />
Leisure & Aquatic assets in the current condition versus the available funding for this asset,<br />
shown by the black line.<br />
5.0<br />
4.0<br />
3.0<br />
$<br />
M<br />
2.0<br />
1.0<br />
2000 2002 2003 2004 2006 2007 2009 2010* 2011<br />
Imp 3.8 3.9 3.9 4.1 3.9 3.7 3.7 4.2 4.1<br />
Sat 3.4 3.3 2.9 3.4 3.7 3.6 3.7 3.8 3.7<br />
NAMS.PLUS2: Leisure & Aquatic S2_V2 (updated 11-2-13)<br />
Community’s Importance Rating<br />
Community’s Satisfaction Rating<br />
Risks<br />
Having insufficient resources to complete priority upgrades<br />
to meet current standards, specifically Lawson<br />
and Katoomba Outdoor pools.<br />
Having insufficient resources to replace failed equipment.<br />
Increasing costs of electricity and water.<br />
Response<br />
Operate pools with a comprehensive risk management<br />
system and increased water testing regime.<br />
Implement innovative energy and water saving initiatives.<br />
Monitor water and electricity usage.<br />
Increase use of the facilities through targeting programming<br />
to maintain the ratio of funding.<br />
<strong>Summary</strong> of Asset Costs<br />
WHOLE OF LIFE GAP<br />
10 YEAR GAP<br />
64