Supporting Document - Attachment 2 - Summary Dashboards - IPART
Supporting Document - Attachment 2 - Summary Dashboards - IPART
Supporting Document - Attachment 2 - Summary Dashboards - IPART

Create successful ePaper yourself
Turn your PDF publications into a flip-book with our unique Google optimized e-Paper software.
ATTACHMENT 2<br />
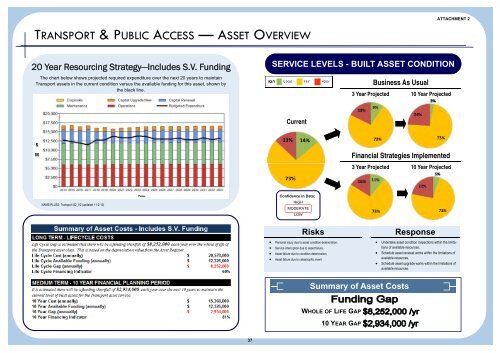
TRANSPORT & PUBLIC ACCESS — ASSET OVERVIEW<br />
20 Year Resourcing Strategy—Includes S.V. Funding<br />
The chart below shows projected required expenditure over the next 20 years to maintain<br />
Transport assets in the current condition versus the available funding for this asset, shown by<br />
the black line.<br />
SERVICE LEVELS - BUILT ASSET CONDITION<br />
Business As Usual<br />
3 Year Projected 10 Year Projected<br />
Current<br />
$<br />
M<br />
Financial Strategies Implemented<br />
3 Year Projected 10 Year Projected<br />
NAMS.PLUS2: Transport S2_V2 (updated 11-2-13)<br />
Confidence in Data:<br />
HIGH<br />
MODERATE<br />
LOW<br />
Risks<br />
Personal injury due to asset condition deterioration,<br />
Service interruption due to asset failure,<br />
Asset failure due to condition deterioration,<br />
Asset failure due to catastrophic event<br />
Response<br />
Undertake asset condition inspections within the limitations<br />
of available resources,<br />
Schedule asset renewal works within the limitations of<br />
available resources,<br />
Schedule asset upgrade works within the limitations of<br />
available resources.<br />
<strong>Summary</strong> of Asset Costs<br />
WHOLE OF LIFE GAP<br />
10 YEAR GAP<br />
37