Supporting Document - Attachment 2 - Summary Dashboards - IPART
Supporting Document - Attachment 2 - Summary Dashboards - IPART
Supporting Document - Attachment 2 - Summary Dashboards - IPART

You also want an ePaper? Increase the reach of your titles
YUMPU automatically turns print PDFs into web optimized ePapers that Google loves.
ATTACHMENT 2<br />
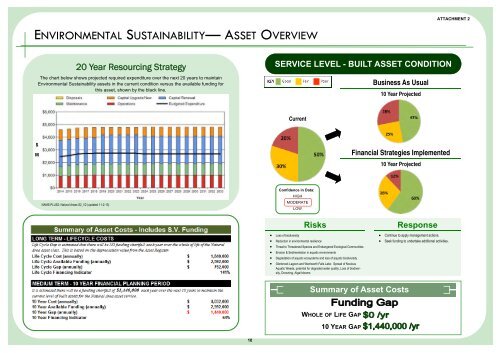
ENVIRONMENTAL SUSTAINABILITY— ASSET OVERVIEW<br />
20 Year Resourcing Strategy<br />
The chart below shows projected required expenditure over the next 20 years to maintain<br />
Environmental Sustainability assets in the current condition versus the available funding for<br />
this asset, shown by the black line.<br />
SERVICE LEVEL - BUILT ASSET CONDITION<br />
Business As Usual<br />
10 Year Projected<br />
Current<br />
$<br />
M<br />
Financial Strategies Implemented<br />
10 Year Projected<br />
NAMS.PLUS2: Natural Areas S2_V2 (updated 11-2-13)<br />
Confidence in Data:<br />
HIGH<br />
MODERATE<br />
LOW<br />
Risks<br />
Loss of biodiversity<br />
Reduction in environmental resilience<br />
Threat to Threatened Species and Endangered Ecological Communities<br />
Erosion & Sedimentation in aquatic environments<br />
Degradation of aquatic ecosystems and loss of aquatic biodiversity<br />
Glenbrook Lagoon and Wentworth Falls Lake: Spread of Noxious<br />
Aquatic Weeds, potential for degraded water quality, Loss of biodiversity,<br />
Drowning, Algal blooms<br />
Response<br />
Continue to apply management actions.<br />
Seek funding to undertake additional activities.<br />
<strong>Summary</strong> of Asset Costs<br />
WHOLE OF LIFE GAP<br />
10 YEAR GAP<br />
10