Supporting Document - Attachment 2 - Summary Dashboards - IPART
Supporting Document - Attachment 2 - Summary Dashboards - IPART
Supporting Document - Attachment 2 - Summary Dashboards - IPART

You also want an ePaper? Increase the reach of your titles
YUMPU automatically turns print PDFs into web optimized ePapers that Google loves.
ATTACHMENT 2<br />
ASSET SUMMARY<br />
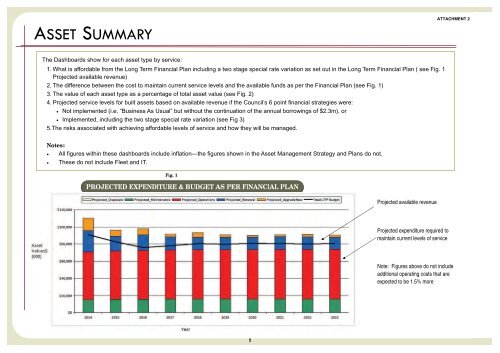
The <strong>Dashboards</strong> show for each asset type by service:<br />
1. What is affordable from the Long Term Financial Plan including a two stage special rate variation as set out in the Long Term Financial Plan ( see Fig. 1<br />
Projected available revenue)<br />
2. The difference between the cost to maintain current service levels and the available funds as per the Financial Plan (see Fig. 1)<br />
3. The value of each asset type as a percentage of total asset value (see Fig. 2)<br />
4. Projected service levels for built assets based on available revenue if the Council’s 6 point financial strategies were:<br />
Not implemented (i.e. “Business As Usual” but without the continuation of the annual borrowings of $2.3m), or<br />
Implemented, including the two stage special rate variation (see Fig 3)<br />
5.The risks associated with achieving affordable levels of service and how they will be managed.<br />
Notes:<br />
All figures within these dashboards include inflation—the figures shown in the Asset Management Strategy and Plans do not.<br />
<br />
These do not include Fleet and IT.<br />
Fig. 1<br />
PROJECTED EXPENDITURE & BUDGET AS PER FINANCIAL PLAN<br />
Projected available revenue<br />
Projected expenditure required to<br />
maintain current levels of service<br />
Note: Figures above do not include<br />
additional operating costs that are<br />
expected to be 1.5% more<br />
5