Supporting Document - Attachment 2 - Summary Dashboards - IPART
Supporting Document - Attachment 2 - Summary Dashboards - IPART
Supporting Document - Attachment 2 - Summary Dashboards - IPART

You also want an ePaper? Increase the reach of your titles
YUMPU automatically turns print PDFs into web optimized ePapers that Google loves.
ATTACHMENT 2<br />
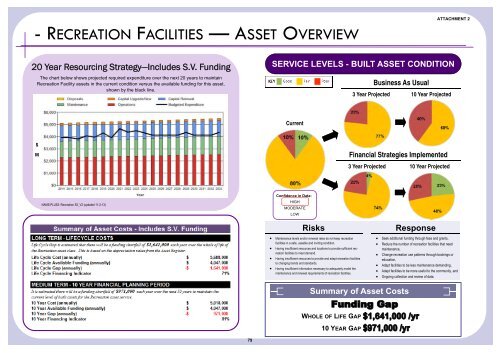
- RECREATION FACILITIES — ASSET OVERVIEW<br />
20 Year Resourcing Strategy—Includes S.V. Funding<br />
The chart below shows projected required expenditure over the next 20 years to maintain<br />
Recreation Facility assets in the current condition versus the available funding for this asset,<br />
shown by the black line.<br />
SERVICE LEVELS - BUILT ASSET CONDITION<br />
Business As Usual<br />
3 Year Projected 10 Year Projected<br />
Current<br />
$<br />
M<br />
Financial Strategies Implemented<br />
3 Year Projected 10 Year Projected<br />
NAMS.PLUS2: Recreation S2_V2 (updated 11-2-13)<br />
Confidence in Data:<br />
HIGH<br />
MODERATE<br />
LOW<br />
Risks<br />
Maintenance levels and/or renewal rates do not keep recreation<br />
facilities in a safe, useable and inviting condition.<br />
Having insufficient resources and locations to provide sufficient recreation<br />
facilities to meet demand.<br />
Having insufficient resources to provide and adapt recreation facilities<br />
to changing trends and standards.<br />
Having insufficient information necessary to adequately model the<br />
maintenance and renewal requirements of recreation facilities.<br />
Response<br />
Seek additional funding through fees and grants,<br />
Reduce the number of recreation facilities that need<br />
maintenance,<br />
Change recreation use patterns through bookings or<br />
education,<br />
Adapt facilities to be less maintenance demanding,<br />
Adapt facilities to be more useful to the community, and<br />
Ongoing collection and review of data.<br />
<strong>Summary</strong> of Asset Costs<br />
WHOLE OF LIFE GAP<br />
10 YEAR GAP<br />
79