Supporting Document - Attachment 2 - Summary Dashboards - IPART
Supporting Document - Attachment 2 - Summary Dashboards - IPART
Supporting Document - Attachment 2 - Summary Dashboards - IPART

Create successful ePaper yourself
Turn your PDF publications into a flip-book with our unique Google optimized e-Paper software.
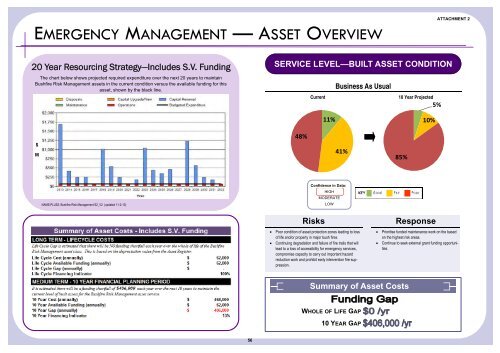
EMERGENCY MANAGEMENT — ASSET OVERVIEW<br />
ATTACHMENT 2<br />
20 Year Resourcing Strategy—Includes S.V. Funding<br />
The chart below shows projected required expenditure over the next 20 years to maintain<br />
Bushfire Risk Management assets in the current condition versus the available funding for this<br />
asset, shown by the black line.<br />
SERVICE LEVEL—BUILT ASSET CONDITION<br />
Business As Usual<br />
Current<br />
10 Year Projected<br />
5%<br />
11%<br />
10%<br />
$<br />
M<br />
48%<br />
41%<br />
85%<br />
NAMS.PLUS2: Bushfire Risk Management S2_V2 (updated 11-2-13)<br />
Confidence in Data:<br />
HIGH<br />
MODERATE<br />
LOW<br />
Risks<br />
Poor condition of asset protection zones leading to loss<br />
of life and/or property in major bush fires.<br />
Continuing degradation and failure of fire trails that will<br />
lead to a loss of accessibility for emergency services,<br />
compromise capacity to carry out important hazard<br />
reduction work and prohibit early intervention fire suppression.<br />
Response<br />
Prioritise funded maintenance work on the based<br />
on the highest risk areas.<br />
Continue to seek external grant funding opportunities.<br />
<strong>Summary</strong> of Asset Costs<br />
WHOLE OF LIFE GAP<br />
10 YEAR GAP<br />
56