Juvenile Justice System and Risk Factor Data - Illinois Criminal ...
Juvenile Justice System and Risk Factor Data - Illinois Criminal ...
Juvenile Justice System and Risk Factor Data - Illinois Criminal ...

You also want an ePaper? Increase the reach of your titles
YUMPU automatically turns print PDFs into web optimized ePapers that Google loves.
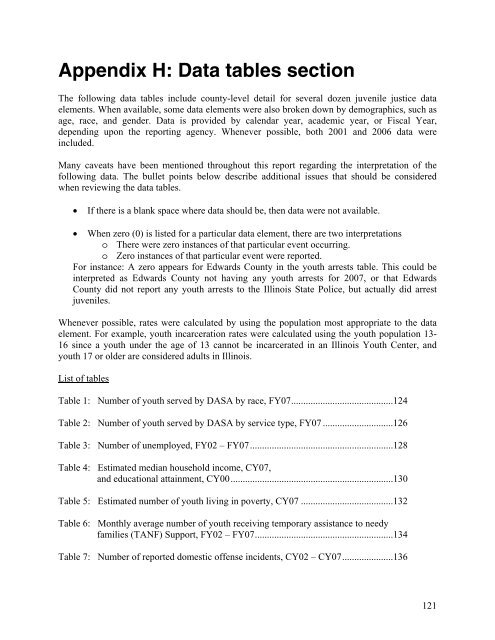
Appendix H: <strong>Data</strong> tables section<br />
The following data tables include county-level detail for several dozen juvenile justice data<br />
elements. When available, some data elements were also broken down by demographics, such as<br />
age, race, <strong>and</strong> gender. <strong>Data</strong> is provided by calendar year, academic year, or Fiscal Year,<br />
depending upon the reporting agency. Whenever possible, both 2001 <strong>and</strong> 2006 data were<br />
included.<br />
Many caveats have been mentioned throughout this report regarding the interpretation of the<br />
following data. The bullet points below describe additional issues that should be considered<br />
when reviewing the data tables.<br />
• If there is a blank space where data should be, then data were not available.<br />
• When zero (0) is listed for a particular data element, there are two interpretations<br />
o There were zero instances of that particular event occurring.<br />
o Zero instances of that particular event were reported.<br />
For instance: A zero appears for Edwards County in the youth arrests table. This could be<br />
interpreted as Edwards County not having any youth arrests for 2007, or that Edwards<br />
County did not report any youth arrests to the <strong>Illinois</strong> State Police, but actually did arrest<br />
juveniles.<br />
Whenever possible, rates were calculated by using the population most appropriate to the data<br />
element. For example, youth incarceration rates were calculated using the youth population 13-<br />
16 since a youth under the age of 13 cannot be incarcerated in an <strong>Illinois</strong> Youth Center, <strong>and</strong><br />
youth 17 or older are considered adults in <strong>Illinois</strong>.<br />
List of tables<br />
Table 1: Number of youth served by DASA by race, FY07..........................................124<br />
Table 2: Number of youth served by DASA by service type, FY07 .............................126<br />
Table 3: Number of unemployed, FY02 – FY07...........................................................128<br />
Table 4: Estimated median household income, CY07,<br />
<strong>and</strong> educational attainment, CY00...................................................................130<br />
Table 5: Estimated number of youth living in poverty, CY07 ......................................132<br />
Table 6: Monthly average number of youth receiving temporary assistance to needy<br />
families (TANF) Support, FY02 – FY07.........................................................134<br />
Table 7: Number of reported domestic offense incidents, CY02 – CY07.....................136<br />
121