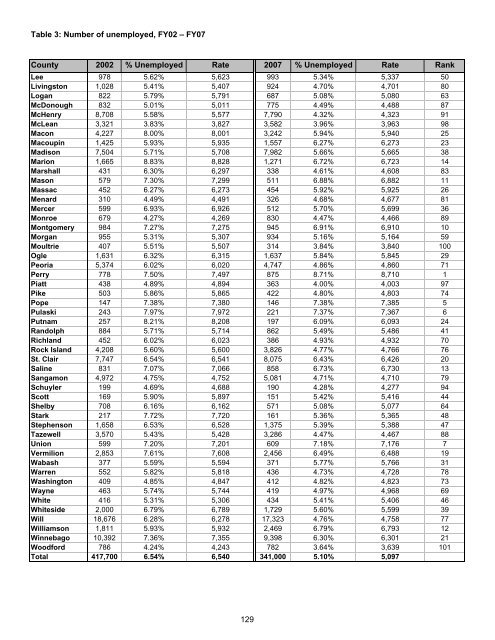
Table 3: Number of unemployed, FY02 – FY07 Source: <strong>Illinois</strong> Department of Employment Security Rate per 100,000 Persons in the Labor Force County 2002 % Unemployed Rate 2007 % Unemployed Rate Rank Adams 1,695 4.72% 4,719 1,627 4.11% 4,113 96 Alex<strong>and</strong>er 332 9.53% 9,535 284 8.16% 8,163 4 Bond 474 5.73% 5,734 479 5.47% 5,466 42 Boone 1,737 7.75% 7,748 1,856 6.93% 6,934 9 Brown 112 3.68% 3,684 101 2.91% 2,911 102 Bureau 1,121 6.08% 6,076 1,000 5.14% 5,135 61 Calhoun 160 6.53% 6,531 185 6.97% 6,965 8 Carroll 599 7.21% 7,207 466 5.32% 5,319 51 Cass 367 5.09% 5,085 349 4.53% 4,531 85 Champaign 4,246 4.26% 4,263 4,657 4.44% 4,436 90 Christian 1,068 6.20% 6,200 949 5.28% 5,278 53 Clark 598 6.96% 6,961 526 5.86% 5,861 28 Clay 464 6.77% 6,769 408 5.83% 5,830 30 Clinton 896 4.95% 4,946 962 4.98% 4,977 68 Coles 1,591 5.84% 5,838 1,290 4.62% 4,618 82 Cook 196,622 7.42% 7,416 137,941 5.23% 5,235 56 Crawford 623 6.64% 6,642 565 5.76% 5,755 32 Cumberl<strong>and</strong> 374 6.56% 6,561 311 5.36% 5,360 49 DeKalb 2,788 5.47% 5,467 2,707 4.60% 4,599 84 DeWitt 562 6.68% 6,679 438 5.10% 5,096 62 Douglas 532 5.00% 4,999 475 4.50% 4,504 86 DuPage 28,671 5.50% 5,498 20,525 3.84% 3,844 99 Edgar 599 6.09% 6,094 574 5.41% 5,413 45 Edwards 180 5.13% 5,125 178 5.15% 5,155 60 Effingham 984 5.55% 5,549 808 4.29% 4,289 93 Fayette 705 7.13% 7,133 686 6.63% 6,633 17 Ford 348 4.80% 4,803 384 5.23% 5,229 57 Franklin 1,400 8.20% 8,198 1,510 8.26% 8,257 3 Fulton 1,220 7.00% 6,996 998 5.57% 5,572 40 Gallatin 205 7.47% 7,465 173 6.49% 6,492 18 Greene 430 6.13% 6,130 378 5.27% 5,268 54 Grundy 1,534 7.30% 7,304 1,475 5.69% 5,686 37 Hamilton 258 6.44% 6,437 254 5.89% 5,895 27 Hancock 632 5.99% 5,985 569 5.71% 5,705 35 Hardin 157 8.09% 8,093 147 8.58% 8,576 2 Henderson 273 6.65% 6,646 233 5.74% 5,739 33 Henry 1,487 5.68% 5,676 1,410 5.07% 5,071 67 Iroquois 967 6.08% 6,081 885 5.27% 5,267 55 Jackson 1,537 5.01% 5,009 1,606 4.85% 4,849 72 Jasper 303 5.78% 5,778 283 5.44% 5,439 43 Jefferson 1,175 6.01% 6,007 1,107 5.19% 5,187 58 Jersey 633 5.71% 5,706 677 5.71% 5,708 34 JoDaviess 632 5.01% 5,011 587 4.26% 4,263 95 Johnson 301 5.99% 5,986 353 6.68% 6,678 15 Kane 15,208 6.51% 6,515 12,867 4.80% 4,800 75 Kankakee 3,503 6.74% 6,743 3,710 6.64% 6,639 16 Kendall 1,918 5.46% 5,465 2,413 4.30% 4,299 92 Knox 1,934 7.24% 7,243 1,359 5.31% 5,306 52 Lake 18,813 5.52% 5,520 18,876 5.07% 5,073 66 LaSalle 4,041 7.30% 7,301 3,727 6.30% 6,295 22 Lawrence 458 5.54% 5,539 427 5.07% 5,075 65 128
Table 3: Number of unemployed, FY02 – FY07 County 2002 % Unemployed Rate 2007 % Unemployed Rate Rank Lee 978 5.62% 5,623 993 5.34% 5,337 50 Livingston 1,028 5.41% 5,407 924 4.70% 4,701 80 Logan 822 5.79% 5,791 687 5.08% 5,080 63 McDonough 832 5.01% 5,011 775 4.49% 4,488 87 McHenry 8,708 5.58% 5,577 7,790 4.32% 4,323 91 McLean 3,321 3.83% 3,827 3,582 3.96% 3,963 98 Macon 4,227 8.00% 8,001 3,242 5.94% 5,940 25 Macoupin 1,425 5.93% 5,935 1,557 6.27% 6,273 23 Madison 7,504 5.71% 5,708 7,982 5.66% 5,665 38 Marion 1,665 8.83% 8,828 1,271 6.72% 6,723 14 Marshall 431 6.30% 6,297 338 4.61% 4,608 83 Mason 579 7.30% 7,299 511 6.88% 6,882 11 Massac 452 6.27% 6,273 454 5.92% 5,925 26 Menard 310 4.49% 4,491 326 4.68% 4,677 81 Mercer 599 6.93% 6,926 512 5.70% 5,699 36 Monroe 679 4.27% 4,269 830 4.47% 4,466 89 Montgomery 984 7.27% 7,275 945 6.91% 6,910 10 Morgan 955 5.31% 5,307 934 5.16% 5,164 59 Moultrie 407 5.51% 5,507 314 3.84% 3,840 100 Ogle 1,631 6.32% 6,315 1,637 5.84% 5,845 29 Peoria 5,374 6.02% 6,020 4,747 4.86% 4,860 71 Perry 778 7.50% 7,497 875 8.71% 8,710 1 Piatt 438 4.89% 4,894 363 4.00% 4,003 97 Pike 503 5.86% 5,865 422 4.80% 4,803 74 Pope 147 7.38% 7,380 146 7.38% 7,385 5 Pulaski 243 7.97% 7,972 221 7.37% 7,367 6 Putnam 257 8.21% 8,208 197 6.09% 6,093 24 R<strong>and</strong>olph 884 5.71% 5,714 862 5.49% 5,486 41 Richl<strong>and</strong> 452 6.02% 6,023 386 4.93% 4,932 70 Rock Isl<strong>and</strong> 4,208 5.60% 5,600 3,826 4.77% 4,766 76 St. Clair 7,747 6.54% 6,541 8,075 6.43% 6,426 20 Saline 831 7.07% 7,066 858 6.73% 6,730 13 Sangamon 4,972 4.75% 4,752 5,081 4.71% 4,710 79 Schuyler 199 4.69% 4,688 190 4.28% 4,277 94 Scott 169 5.90% 5,897 151 5.42% 5,416 44 Shelby 708 6.16% 6,162 571 5.08% 5,077 64 Stark 217 7.72% 7,720 161 5.36% 5,365 48 Stephenson 1,658 6.53% 6,528 1,375 5.39% 5,388 47 Tazewell 3,570 5.43% 5,428 3,286 4.47% 4,467 88 Union 599 7.20% 7,201 609 7.18% 7,176 7 Vermilion 2,853 7.61% 7,608 2,456 6.49% 6,488 19 Wabash 377 5.59% 5,594 371 5.77% 5,766 31 Warren 552 5.82% 5,818 436 4.73% 4,728 78 Washington 409 4.85% 4,847 412 4.82% 4,823 73 Wayne 463 5.74% 5,744 419 4.97% 4,968 69 White 416 5.31% 5,306 434 5.41% 5,406 46 Whiteside 2,000 6.79% 6,789 1,729 5.60% 5,599 39 Will 18,676 6.28% 6,278 17,323 4.76% 4,758 77 Williamson 1,811 5.93% 5,932 2,469 6.79% 6,793 12 Winnebago 10,392 7.36% 7,355 9,398 6.30% 6,301 21 Woodford 786 4.24% 4,243 782 3.64% 3,639 101 Total 417,700 6.54% 6,540 341,000 5.10% 5,097 129
- Page 1:
State of Illinois Pat Quinn, Govern
- Page 4 and 5:
Acknowledgments We wish to acknowle
- Page 6 and 7:
State initiatives .................
- Page 8 and 9:
Table 18: Number and percentage of
- Page 10 and 11:
Figure 16: Rate of youth adjudicate
- Page 13 and 14:
Foreword The Illinois Criminal Just
- Page 15 and 16:
Poverty In calendar year 2007, 524,
- Page 17 and 18:
Illinois juvenile justice system da
- Page 19 and 20:
Special issues Disproportionate min
- Page 21 and 22:
Youth courts Youth courts, also cal
- Page 23 and 24:
Introduction Since 2003, the Illino
- Page 25 and 26:
The Juvenile Justice System and Ris
- Page 27 and 28:
Figure 1 Flowchart of the Illinois
- Page 29 and 30:
Table 1 Legislative changes from th
- Page 31 and 32:
• Competency development. Restora
- Page 33 and 34:
Community risk factors Community ri
- Page 35 and 36:
Education In 2000, the most recent
- Page 37 and 38:
Social context The data elements ex
- Page 39 and 40:
neglect. That year, 28,516 cases of
- Page 41 and 42:
Correctional inmates with children
- Page 43 and 44:
Chronic truants are students who ha
- Page 45 and 46:
Expulsions During AY07, 3,451 stude
- Page 47 and 48:
important protective factors agains
- Page 49 and 50:
An alternate source for youth arres
- Page 51 and 52:
Arrest data by offense category is
- Page 53 and 54:
Court data After being arrested a y
- Page 55 and 56:
Map 2 P ercent change in rate of ne
- Page 57 and 58:
Map 3 Percent change in rate of you
- Page 59 and 60:
Detention data information Data col
- Page 61 and 62:
The Central region of Illinois expe
- Page 63 and 64:
Transfers to criminal court Youth 1
- Page 65 and 66:
Map 5 Number of detained youth tran
- Page 67 and 68:
The rate of formal probation cases
- Page 69 and 70:
Informal probation caseloads The nu
- Page 71 and 72:
Delinquency petitions continued und
- Page 73 and 74:
Map 8 Percent change in rate of you
- Page 75 and 76:
adult would. Mandatory supervised r
- Page 77 and 78:
Map 9 Percent change in rate of you
- Page 79 and 80:
Of court commitments in FY07, 28 pe
- Page 81 and 82:
2004, increasing 28 percent from 1,
- Page 83 and 84:
Special issues Disproportionate min
- Page 85 and 86:
Calculate the jurisdictional RI usi
- Page 87 and 88:
under-represented at 52 percent les
- Page 89 and 90:
Table 10 RRI calculations for black
- Page 91 and 92:
Detention In 2007, the rates of adm
- Page 93 and 94:
Map 12 Hispanic youth detention rel
- Page 95 and 96:
Map 13 Black youth IDJJ relative ra
- Page 97 and 98:
Table 14 provides a statewide overv
- Page 99 and 100: From 1997 to 2007, there was a 65 p
- Page 101 and 102: Table 17 shows the number of youth
- Page 103 and 104: Females in secure detention Females
- Page 105 and 106: screening after referral from a juv
- Page 107 and 108: Specialized courts Juvenile drug co
- Page 109 and 110: Youth courts Youth courts, also cal
- Page 111 and 112: Record expungement In Illinois, aft
- Page 113 and 114: The Second Judicial Circuit Redeplo
- Page 115 and 116: Models for Change Models for Change
- Page 117 and 118: Map 16 Juvenile justice system init
- Page 119 and 120: is not known how accurate the data
- Page 121 and 122: Further recommendations The recomme
- Page 123 and 124: Automatic transfer (Excluded Jurisd
- Page 125 and 126: Detoxification Discretionary transf
- Page 127 and 128: Job Training Partnership Act (JTPA)
- Page 129 and 130: Property crime index A subcategory
- Page 131 and 132: Appendix B: Map of judicial circuit
- Page 133 and 134: Appendix D: Map of Illinois youth c
- Page 135 and 136: 12 - Homicide, Aggravated Kidnappin
- Page 137 and 138: Offense Offense Offense Offense Cat
- Page 139 and 140: Illinois Department of Corrections
- Page 141: Prevention First 2800 Montvale Driv
- Page 144 and 145: Table 8: Number of reported cases o
- Page 146 and 147: Table 1: Number of services to yout
- Page 148 and 149: Table 2: Number of services to yout
- Page 152 and 153: Table 4: Estimated median household
- Page 154 and 155: Table 5: Estimated number of youth
- Page 156 and 157: Table 6: Monthly average number of
- Page 158 and 159: Table 7: Number of reported domesti
- Page 160 and 161: Table 8: Number of reported cases o
- Page 162 and 163: Table 9: Number of indicated cases
- Page 164 and 165: Table 10: Number of reported cases
- Page 166 and 167: Table 11: Number of indicated cases
- Page 168 and 169: Table 12: Number of reported crimes
- Page 170 and 171: Table 13: Number of inmates admitte
- Page 172 and 173: Table 14: Number of students report
- Page 174 and 175: Table 15: Number and sex of truant,
- Page 176 and 177: Table 16: Number of students suspen
- Page 178 and 179: Table 17: Number of students expell
- Page 180 and 181: Table 18: Number of high school dro
- Page 182 and 183: Table 19: Youth population age 10-1
- Page 184 and 185: Table 20: Youth population by race
- Page 186 and 187: Table 21: Number of youth arrests b
- Page 188 and 189: Table 22: Number of youth arrests b
- Page 190 and 191: Table 23: Number of youth arrests b
- Page 192 and 193: Table 24: Number of youth arrests b
- Page 194 and 195: Table 25: Number and type of court
- Page 196 and 197: Table 26: Number and type of youth
- Page 198 and 199: Table 27: Number of delinquency pet
- Page 200 and 201:
Table 28: Number of youth (ages 10
- Page 202 and 203:
Table 29: Number of youth admission
- Page 204 and 205:
Table 30: Number of youth admission
- Page 206 and 207:
Table 31: Number of youth admission
- Page 208 and 209:
Table 32: Number of youth admission
- Page 210 and 211:
Table 33: Average daily population
- Page 212 and 213:
Table 34: Number of youth transfers
- Page 214 and 215:
Table 35: Number of active youth fo
- Page 216 and 217:
Table 36: Number of active informal
- Page 218 and 219:
Table 37: Number of youth delinquen
- Page 220 and 221:
Table 38: Number of youth probation
- Page 222 and 223:
Table 39: Number and type of court
- Page 224 and 225:
Table 40: Number and type of youth
- Page 226 and 227:
Table 41: Number and type of youth
- Page 228 and 229:
Table 42: Number and type of youth
- Page 230 and 231:
Table 43: Number of youth (age 13 t
- Page 232 and 233:
Table 44: Number of youth (age 13 t
- Page 234 and 235:
Table 45: Number of youth (age 13 t
- Page 236 and 237:
Table 46: Number of youth released
- Page 238 and 239:
Table 47: Representation index (RI)
- Page 240 and 241:
Table 48: Representation index (RI)
- Page 242 and 243:
Table 49: Representation index (RI)
- Page 244 and 245:
Notes 1 Griffin, Patrick, Linda Szy
- Page 246:
41 Shelden, Randall G., Detention D