Juvenile Justice System and Risk Factor Data - Illinois Criminal ...
Juvenile Justice System and Risk Factor Data - Illinois Criminal ...
Juvenile Justice System and Risk Factor Data - Illinois Criminal ...

Create successful ePaper yourself
Turn your PDF publications into a flip-book with our unique Google optimized e-Paper software.
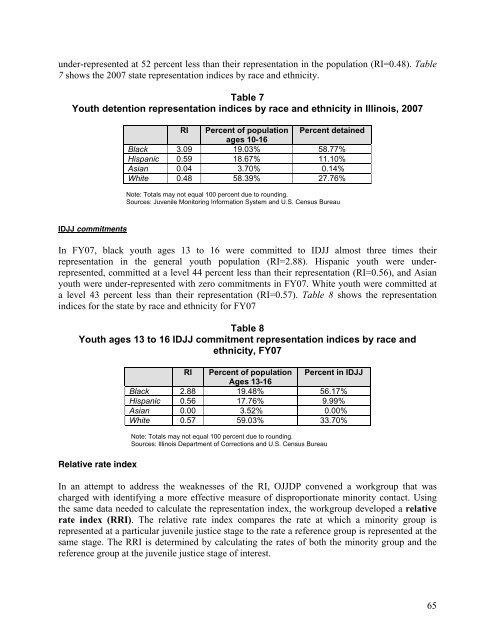
under-represented at 52 percent less than their representation in the population (RI=0.48). Table<br />
7 shows the 2007 state representation indices by race <strong>and</strong> ethnicity.<br />
Table 7<br />
Youth detention representation indices by race <strong>and</strong> ethnicity in <strong>Illinois</strong>, 2007<br />
RI Percent of population Percent detained<br />
ages 10-16<br />
Black 3.09 19.03% 58.77%<br />
Hispanic 0.59 18.67% 11.10%<br />
Asian 0.04 3.70%<br />
0.14%<br />
White 0.48 58.39% 27.76%<br />
Note: Totals may not equal 100 percent due to rounding.<br />
Sources: <strong>Juvenile</strong> Monitoring Information <strong>System</strong> <strong>and</strong> U.S. Census Bureau<br />
IDJJ commitments<br />
In FY07, black youth ages 13 to 16 were committed to IDJJ almost three times their<br />
representation in the general youth population (RI=2.88). Hispanic youth were underrepresented,<br />
committed at a level 44 percen t less than their representation (RI=0.56), <strong>and</strong> Asian<br />
youth were under-represented with zero commitments in FY07. White youth were committed at<br />
a level 43 percent less than their representation (RI=0.57). Table 8 shows the representation<br />
indices for the state by race <strong>and</strong> ethnicity for FY07<br />
Table 8<br />
Youth ages 13 to 16 IDJJ com mitment representation indices by race <strong>and</strong><br />
ethnicity, FY07<br />
RI Percent of population Percent in IDJJ<br />
Ages 13-16<br />
Black 2.88 19.48% 56.17%<br />
Hispanic 0.56 17.76% 9.99%<br />
Asian 0.00 3.52% 0.00%<br />
White 0.57 59.03% 33.70%<br />
Note: Totals may not equal 100 percent due to rounding.<br />
Sources: <strong>Illinois</strong> Department of Corrections <strong>and</strong> U.S. Census Bureau<br />
Relative rate index<br />
In an attempt to address the weaknesses of the RI, OJJDP convened a workgroup that was<br />
charged with identifying a more effective measure of disproportionate minority contact. Using<br />
the same data needed to calculate the representation index, the workgroup developed a relative<br />
rate index (RRI). The relative rate index compares the rate at which a minority group is<br />
represented at a particular juvenile justice stage to the rate a reference group is represented at the<br />
same stage. The RRI is determined by calculating the rates of both the minority group <strong>and</strong> the<br />
reference group at the juvenile justice stage of interest.<br />
65