Juvenile Justice System and Risk Factor Data - Illinois Criminal ...
Juvenile Justice System and Risk Factor Data - Illinois Criminal ...
Juvenile Justice System and Risk Factor Data - Illinois Criminal ...

You also want an ePaper? Increase the reach of your titles
YUMPU automatically turns print PDFs into web optimized ePapers that Google loves.
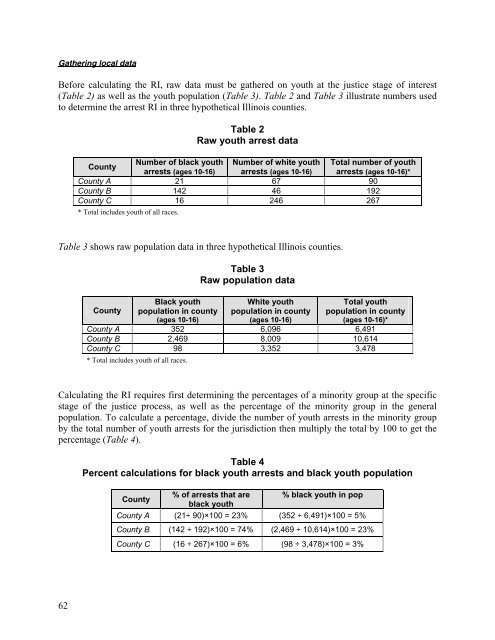
Gathering local data<br />
Before calculating the RI, raw data must be gathered on youth at the justice stage of interest<br />
(Table 2) as well as the youth population (Table 3). Table 2 <strong>and</strong> Table 3 illustrate numbers used<br />
to determine the arrest RI in three hypothetical <strong>Illinois</strong> counties.<br />
Table 2<br />
Raw youth arrest data<br />
County<br />
Number of black youth Number of white youth Total number of youth<br />
arrests (ages 10-16) arrests (ages 10-16) arrests (ages 10-16)*<br />
County A 21 67 90<br />
County B 142 46 192<br />
County C 16 246 267<br />
* Total includes youth of all races.<br />
Table 3 shows raw population data in three hypothetical <strong>Illinois</strong> counties.<br />
Table 3<br />
Raw population data<br />
Black youth<br />
White youth<br />
Total youth<br />
County population in county population in county population in county<br />
(ages 10-16)<br />
(ages 10-16) (ages 10-16)*<br />
County A 352 6,096 6,491<br />
County B 2,469 8,009 10,614<br />
County C 98 3,352 3,478<br />
* Total includes youth of all races.<br />
Calculating the RI requires first determining the percentages of a minority group at the specific<br />
stage of the justice process, as well as the percentage of the minority group in the general<br />
population. To calculate a percentage, divide the number of youth arrests in the minority group<br />
by the total number of youth arrests for the jurisdiction then multiply the total by 100 to get the<br />
percentage (Table 4).<br />
Table 4<br />
Percent calculations for black youth arrests <strong>and</strong> black youth population<br />
% of arrests that are % black youth in pop<br />
County<br />
black youth<br />
County A (21÷ 90)×100 = 23% (352 ÷ 6,491)×100 = 5%<br />
County B (142 ÷ 192)×100 = 74% (2,469 ÷ 10,614)×100 = 23%<br />
County C (16 ÷ 267)×100 = 6% (98 ÷ 3,478)×100 = 3%<br />
62