Juvenile Justice System and Risk Factor Data - Illinois Criminal ...
Juvenile Justice System and Risk Factor Data - Illinois Criminal ...
Juvenile Justice System and Risk Factor Data - Illinois Criminal ...

You also want an ePaper? Increase the reach of your titles
YUMPU automatically turns print PDFs into web optimized ePapers that Google loves.
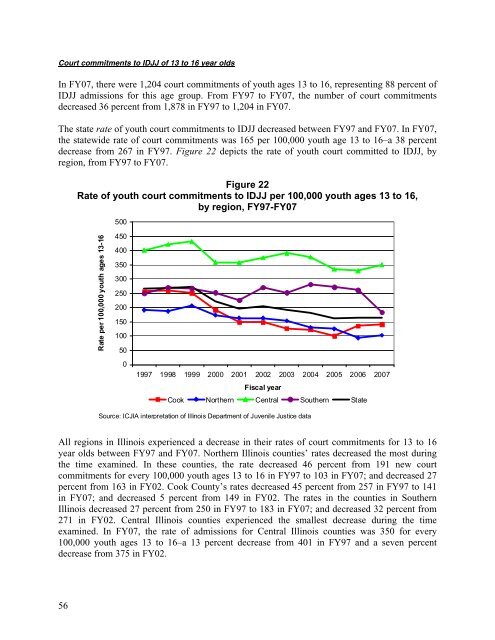
Court commitments to IDJJ of 13 to 16 year olds<br />
In FY07, there were 1,204 court commitments of youth ages 13 to 16, representing 88 percent of<br />
IDJJ admissions for this age group. From FY97 to FY07, the number of court commitments<br />
decreased 36 percent from 1,878 in FY97 to 1,204 in FY07.<br />
The state rate of youth court commitments to IDJJ decreased between FY97 <strong>and</strong> FY07. In FY07,<br />
the statewide rate of court commitments was 165 per 100,000 youth age 13 to 16–a 38 percent<br />
decrease from 267 in FY97. Figure 22 depicts the rate of youth court committed to IDJJ, by<br />
region, from FY97 to FY07.<br />
Figure 22<br />
Rate of youth court commitments to IDJJ per 100,000 youth ages 13 to 16,<br />
by region, FY97-FY07<br />
500<br />
Rate per 100,000 youth ages 13-16<br />
450<br />
400<br />
350<br />
300<br />
250<br />
200<br />
150<br />
100<br />
50<br />
0<br />
1997 1998 1999 2000 2001 2002 2003 2004 2005 2006 2007<br />
Fiscal year<br />
Cook Northern Central Southern State<br />
Source: ICJIA interpretation of <strong>Illinois</strong> Department of <strong>Juvenile</strong> <strong>Justice</strong> data<br />
All regions in <strong>Illinois</strong> experienced a decrease in their rates of court commitments for 13 to 16<br />
year olds between FY97 <strong>and</strong> FY07. Northern <strong>Illinois</strong> counties’ rates decreased the most during<br />
the time examined. In these counties, the rate decreased 46 percent from 191 new court<br />
commitments for every 100,000 youth ages 13 to 16 in FY97 to 103 in FY07; <strong>and</strong> decreased 27<br />
percent from 163 in FY02. Cook County’s rates decreased 45 percent from 257 in FY97 to 141<br />
in FY07; <strong>and</strong> decreased 5 percent from 149 in FY02. The rates in the counties in Southern<br />
<strong>Illinois</strong> decreased 27 percent from 250 in FY97 to 183 in FY07; <strong>and</strong> decreased 32 percent from<br />
271 in FY02. Central <strong>Illinois</strong> counties experienced the smallest decrease during the time<br />
examined. In FY07, the rate of admissions for Central <strong>Illinois</strong> counties was 350 for every<br />
100,000 youth ages 13 to 16–a 13 percent decrease from 401 in FY97 <strong>and</strong> a seven percent<br />
decrease from 375 in FY02.<br />
56