- Page 1:
State of Illinois Pat Quinn, Govern
- Page 4 and 5:
Acknowledgments We wish to acknowle
- Page 6 and 7:
State initiatives .................
- Page 8 and 9:
Table 18: Number and percentage of
- Page 10 and 11:
Figure 16: Rate of youth adjudicate
- Page 13 and 14:
Foreword The Illinois Criminal Just
- Page 15 and 16:
Poverty In calendar year 2007, 524,
- Page 17 and 18:
Illinois juvenile justice system da
- Page 19 and 20:
Special issues Disproportionate min
- Page 21 and 22:
Youth courts Youth courts, also cal
- Page 23 and 24:
Introduction Since 2003, the Illino
- Page 25 and 26:
The Juvenile Justice System and Ris
- Page 27 and 28:
Figure 1 Flowchart of the Illinois
- Page 29 and 30:
Table 1 Legislative changes from th
- Page 31 and 32:
• Competency development. Restora
- Page 33 and 34:
Community risk factors Community ri
- Page 35 and 36:
Education In 2000, the most recent
- Page 37 and 38:
Social context The data elements ex
- Page 39 and 40:
neglect. That year, 28,516 cases of
- Page 41 and 42:
Correctional inmates with children
- Page 43 and 44:
Chronic truants are students who ha
- Page 45 and 46: Expulsions During AY07, 3,451 stude
- Page 47 and 48: important protective factors agains
- Page 49 and 50: An alternate source for youth arres
- Page 51 and 52: Arrest data by offense category is
- Page 53 and 54: Court data After being arrested a y
- Page 55 and 56: Map 2 P ercent change in rate of ne
- Page 57 and 58: Map 3 Percent change in rate of you
- Page 59 and 60: Detention data information Data col
- Page 61 and 62: The Central region of Illinois expe
- Page 63 and 64: Transfers to criminal court Youth 1
- Page 65 and 66: Map 5 Number of detained youth tran
- Page 67 and 68: The rate of formal probation cases
- Page 69 and 70: Informal probation caseloads The nu
- Page 71 and 72: Delinquency petitions continued und
- Page 73 and 74: Map 8 Percent change in rate of you
- Page 75 and 76: adult would. Mandatory supervised r
- Page 77 and 78: Map 9 Percent change in rate of you
- Page 79 and 80: Of court commitments in FY07, 28 pe
- Page 81 and 82: 2004, increasing 28 percent from 1,
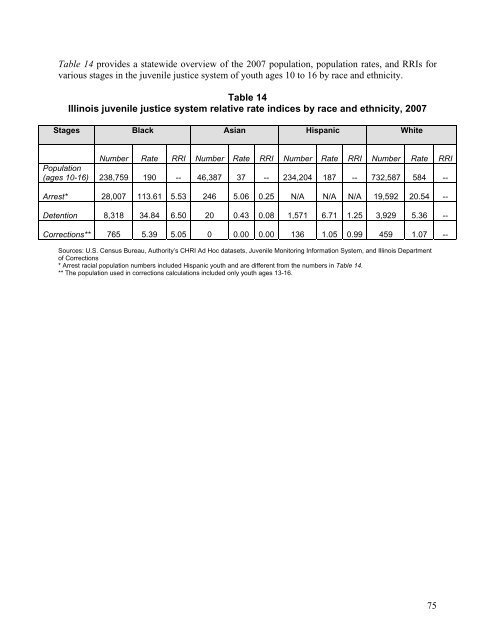
- Page 83 and 84: Special issues Disproportionate min
- Page 85 and 86: Calculate the jurisdictional RI usi
- Page 87 and 88: under-represented at 52 percent les
- Page 89 and 90: Table 10 RRI calculations for black
- Page 91 and 92: Detention In 2007, the rates of adm
- Page 93 and 94: Map 12 Hispanic youth detention rel
- Page 95: Map 13 Black youth IDJJ relative ra
- Page 99 and 100: From 1997 to 2007, there was a 65 p
- Page 101 and 102: Table 17 shows the number of youth
- Page 103 and 104: Females in secure detention Females
- Page 105 and 106: screening after referral from a juv
- Page 107 and 108: Specialized courts Juvenile drug co
- Page 109 and 110: Youth courts Youth courts, also cal
- Page 111 and 112: Record expungement In Illinois, aft
- Page 113 and 114: The Second Judicial Circuit Redeplo
- Page 115 and 116: Models for Change Models for Change
- Page 117 and 118: Map 16 Juvenile justice system init
- Page 119 and 120: is not known how accurate the data
- Page 121 and 122: Further recommendations The recomme
- Page 123 and 124: Automatic transfer (Excluded Jurisd
- Page 125 and 126: Detoxification Discretionary transf
- Page 127 and 128: Job Training Partnership Act (JTPA)
- Page 129 and 130: Property crime index A subcategory
- Page 131 and 132: Appendix B: Map of judicial circuit
- Page 133 and 134: Appendix D: Map of Illinois youth c
- Page 135 and 136: 12 - Homicide, Aggravated Kidnappin
- Page 137 and 138: Offense Offense Offense Offense Cat
- Page 139 and 140: Illinois Department of Corrections
- Page 141: Prevention First 2800 Montvale Driv
- Page 144 and 145: Table 8: Number of reported cases o
- Page 146 and 147:
Table 1: Number of services to yout
- Page 148 and 149:
Table 2: Number of services to yout
- Page 150 and 151:
Table 3: Number of unemployed, FY02
- Page 152 and 153:
Table 4: Estimated median household
- Page 154 and 155:
Table 5: Estimated number of youth
- Page 156 and 157:
Table 6: Monthly average number of
- Page 158 and 159:
Table 7: Number of reported domesti
- Page 160 and 161:
Table 8: Number of reported cases o
- Page 162 and 163:
Table 9: Number of indicated cases
- Page 164 and 165:
Table 10: Number of reported cases
- Page 166 and 167:
Table 11: Number of indicated cases
- Page 168 and 169:
Table 12: Number of reported crimes
- Page 170 and 171:
Table 13: Number of inmates admitte
- Page 172 and 173:
Table 14: Number of students report
- Page 174 and 175:
Table 15: Number and sex of truant,
- Page 176 and 177:
Table 16: Number of students suspen
- Page 178 and 179:
Table 17: Number of students expell
- Page 180 and 181:
Table 18: Number of high school dro
- Page 182 and 183:
Table 19: Youth population age 10-1
- Page 184 and 185:
Table 20: Youth population by race
- Page 186 and 187:
Table 21: Number of youth arrests b
- Page 188 and 189:
Table 22: Number of youth arrests b
- Page 190 and 191:
Table 23: Number of youth arrests b
- Page 192 and 193:
Table 24: Number of youth arrests b
- Page 194 and 195:
Table 25: Number and type of court
- Page 196 and 197:
Table 26: Number and type of youth
- Page 198 and 199:
Table 27: Number of delinquency pet
- Page 200 and 201:
Table 28: Number of youth (ages 10
- Page 202 and 203:
Table 29: Number of youth admission
- Page 204 and 205:
Table 30: Number of youth admission
- Page 206 and 207:
Table 31: Number of youth admission
- Page 208 and 209:
Table 32: Number of youth admission
- Page 210 and 211:
Table 33: Average daily population
- Page 212 and 213:
Table 34: Number of youth transfers
- Page 214 and 215:
Table 35: Number of active youth fo
- Page 216 and 217:
Table 36: Number of active informal
- Page 218 and 219:
Table 37: Number of youth delinquen
- Page 220 and 221:
Table 38: Number of youth probation
- Page 222 and 223:
Table 39: Number and type of court
- Page 224 and 225:
Table 40: Number and type of youth
- Page 226 and 227:
Table 41: Number and type of youth
- Page 228 and 229:
Table 42: Number and type of youth
- Page 230 and 231:
Table 43: Number of youth (age 13 t
- Page 232 and 233:
Table 44: Number of youth (age 13 t
- Page 234 and 235:
Table 45: Number of youth (age 13 t
- Page 236 and 237:
Table 46: Number of youth released
- Page 238 and 239:
Table 47: Representation index (RI)
- Page 240 and 241:
Table 48: Representation index (RI)
- Page 242 and 243:
Table 49: Representation index (RI)
- Page 244 and 245:
Notes 1 Griffin, Patrick, Linda Szy
- Page 246:
41 Shelden, Randall G., Detention D


