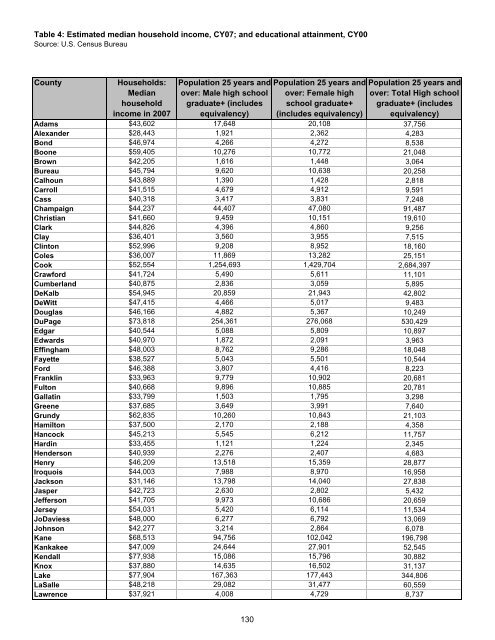
Table 4: Estimated median household income, CY07; <strong>and</strong> educational attainment, CY00 Source: U.S. Census Bureau County Households: Median household income in 2007 Population 25 years <strong>and</strong> over: Male high school graduate+ (includes equivalency) Population 25 years <strong>and</strong> over: Female high school graduate+ (includes equivalency) Population 25 years <strong>and</strong> over: Total High school graduate+ (includes equivalency) Adams $43,602 17,648 20,108 37,756 Alex<strong>and</strong>er $28,443 1,921 2,362 4,283 Bond $46,974 4,266 4,272 8,538 Boone $59,405 10,276 10,772 21,048 Brown $42,205 1,616 1,448 3,064 Bureau $45,794 9,620 10,638 20,258 Calhoun $43,889 1,390 1,428 2,818 Carroll $41,515 4,679 4,912 9,591 Cass $40,318 3,417 3,831 7,248 Champaign $44,237 44,407 47,080 91,487 Christian $41,660 9,459 10,151 19,610 Clark $44,826 4,396 4,860 9,256 Clay $36,401 3,560 3,955 7,515 Clinton $52,996 9,208 8,952 18,160 Coles $36,007 11,869 13,282 25,151 Cook $52,554 1,254,693 1,429,704 2,684,397 Crawford $41,724 5,490 5,611 11,101 Cumberl<strong>and</strong> $40,875 2,836 3,059 5,895 DeKalb $54,945 20,859 21,943 42,802 DeWitt $47,415 4,466 5,017 9,483 Douglas $46,166 4,882 5,367 10,249 DuPage $73,818 254,361 276,068 530,429 Edgar $40,544 5,088 5,809 10,897 Edwards $40,970 1,872 2,091 3,963 Effingham $48,003 8,762 9,286 18,048 Fayette $38,527 5,043 5,501 10,544 Ford $46,388 3,807 4,416 8,223 Franklin $33,963 9,779 10,902 20,681 Fulton $40,668 9,896 10,885 20,781 Gallatin $33,799 1,503 1,795 3,298 Greene $37,685 3,649 3,991 7,640 Grundy $62,835 10,260 10,843 21,103 Hamilton $37,500 2,170 2,188 4,358 Hancock $45,213 5,545 6,212 11,757 Hardin $33,455 1,121 1,224 2,345 Henderson $40,939 2,276 2,407 4,683 Henry $46,209 13,518 15,359 28,877 Iroquois $44,003 7,988 8,970 16,958 Jackson $31,146 13,798 14,040 27,838 Jasper $42,723 2,630 2,802 5,432 Jefferson $41,705 9,973 10,686 20,659 Jersey $54,031 5,420 6,114 11,534 JoDaviess $48,000 6,277 6,792 13,069 Johnson $42,277 3,214 2,864 6,078 Kane $68,513 94,756 102,042 196,798 Kankakee $47,009 24,644 27,901 52,545 Kendall $77,938 15,086 15,796 30,882 Knox $37,880 14,635 16,502 31,137 Lake $77,904 167,363 177,443 344,806 LaSalle $48,218 29,082 31,477 60,559 Lawrence $37,921 4,008 4,729 8,737 130
Table 4: Estimated median household income, CY07 <strong>and</strong> educational attainment, CY00 County Households: Median household income in 2007 Population 25 years <strong>and</strong> over: Male; High school graduate+ (includes equivalency) Population 25 years <strong>and</strong> over: Female; High school graduate+ (includes equivalency) Population 25 years <strong>and</strong> over: Total High school graduate+ (includes equivalency) Lee $47,602 9,580 10,102 19,682 Livingston $47,442 9,793 10,897 20,690 Logan $44,690 7,793 8,862 16,655 McDonough $34,690 7,337 8,264 15,601 McHenry $74,115 71,364 74,766 146,130 McLean $55,018 37,855 41,270 79,125 Macon $44,752 29,173 33,370 62,543 Macoupin $44,025 12,913 14,081 26,994 Madison $52,073 68,326 75,274 143,600 Marion $38,262 10,177 11,748 21,925 Marshall $48,338 3,728 4,033 7,761 Mason $42,946 4,158 4,540 8,698 Massac $38,461 3,812 4,194 8,006 Menard $55,268 3,469 3,861 7,330 Mercer $48,778 4,582 5,207 9,789 Monroe $66,748 7,616 8,329 15,945 Montgomery $39,530 7,869 8,215 16,084 Morgan $41,833 9,055 10,339 19,394 Moultrie $46,868 3,510 3,990 7,500 Ogle $54,425 13,162 14,510 27,672 Peoria $47,150 46,322 53,020 99,342 Perry $38,983 5,706 5,672 11,378 Piatt $55,009 4,709 5,149 9,858 Pike $39,219 4,466 4,981 9,447 Pope $36,421 1,097 1,168 2,265 Pulaski $31,087 1,545 1,782 3,327 Putnam $55,134 1,677 1,791 3,468 R<strong>and</strong>olph $42,980 8,203 8,303 16,506 Richl<strong>and</strong> $38,467 4,172 4,857 9,029 Rock Isl<strong>and</strong> $45,209 38,339 43,288 81,627 St. Clair $46,428 61,292 70,319 131,611 Saline $33,724 6,391 7,399 13,790 Sangamon $48,330 51,289 60,231 111,520 Schuyler $41,023 1,968 2,231 4,199 Scott $44,254 1,478 1,610 3,088 Shelby $41,337 6,173 6,631 12,804 Stark $43,043 1,692 1,906 3,598 Stephenson $43,450 12,995 14,637 27,632 Tazewell $52,745 35,624 38,029 73,653 Union $37,923 4,366 5,129 9,495 Vermilion $38,036 20,636 23,285 43,921 Wabash $45,931 3,420 3,671 7,091 Warren $41,477 4,702 5,276 9,978 Washington $48,727 3,971 4,073 8,044 Wayne $37,783 4,111 4,702 8,813 White $39,797 3,803 4,302 8,105 Whiteside $43,920 15,426 16,964 32,390 Will $71,597 130,730 139,355 270,085 Williamson $38,914 16,024 17,452 33,476 Winnebago $48,394 69,861 78,178 148,039 Woodford $62,349 9,671 10,485 20,156 Total $54,141 3,075,613 3,417,615 6,493,228 131
- Page 1:
State of Illinois Pat Quinn, Govern
- Page 4 and 5:
Acknowledgments We wish to acknowle
- Page 6 and 7:
State initiatives .................
- Page 8 and 9:
Table 18: Number and percentage of
- Page 10 and 11:
Figure 16: Rate of youth adjudicate
- Page 13 and 14:
Foreword The Illinois Criminal Just
- Page 15 and 16:
Poverty In calendar year 2007, 524,
- Page 17 and 18:
Illinois juvenile justice system da
- Page 19 and 20:
Special issues Disproportionate min
- Page 21 and 22:
Youth courts Youth courts, also cal
- Page 23 and 24:
Introduction Since 2003, the Illino
- Page 25 and 26:
The Juvenile Justice System and Ris
- Page 27 and 28:
Figure 1 Flowchart of the Illinois
- Page 29 and 30:
Table 1 Legislative changes from th
- Page 31 and 32:
• Competency development. Restora
- Page 33 and 34:
Community risk factors Community ri
- Page 35 and 36:
Education In 2000, the most recent
- Page 37 and 38:
Social context The data elements ex
- Page 39 and 40:
neglect. That year, 28,516 cases of
- Page 41 and 42:
Correctional inmates with children
- Page 43 and 44:
Chronic truants are students who ha
- Page 45 and 46:
Expulsions During AY07, 3,451 stude
- Page 47 and 48:
important protective factors agains
- Page 49 and 50:
An alternate source for youth arres
- Page 51 and 52:
Arrest data by offense category is
- Page 53 and 54:
Court data After being arrested a y
- Page 55 and 56:
Map 2 P ercent change in rate of ne
- Page 57 and 58:
Map 3 Percent change in rate of you
- Page 59 and 60:
Detention data information Data col
- Page 61 and 62:
The Central region of Illinois expe
- Page 63 and 64:
Transfers to criminal court Youth 1
- Page 65 and 66:
Map 5 Number of detained youth tran
- Page 67 and 68:
The rate of formal probation cases
- Page 69 and 70:
Informal probation caseloads The nu
- Page 71 and 72:
Delinquency petitions continued und
- Page 73 and 74:
Map 8 Percent change in rate of you
- Page 75 and 76:
adult would. Mandatory supervised r
- Page 77 and 78:
Map 9 Percent change in rate of you
- Page 79 and 80:
Of court commitments in FY07, 28 pe
- Page 81 and 82:
2004, increasing 28 percent from 1,
- Page 83 and 84:
Special issues Disproportionate min
- Page 85 and 86:
Calculate the jurisdictional RI usi
- Page 87 and 88:
under-represented at 52 percent les
- Page 89 and 90:
Table 10 RRI calculations for black
- Page 91 and 92:
Detention In 2007, the rates of adm
- Page 93 and 94:
Map 12 Hispanic youth detention rel
- Page 95 and 96:
Map 13 Black youth IDJJ relative ra
- Page 97 and 98:
Table 14 provides a statewide overv
- Page 99 and 100:
From 1997 to 2007, there was a 65 p
- Page 101 and 102: Table 17 shows the number of youth
- Page 103 and 104: Females in secure detention Females
- Page 105 and 106: screening after referral from a juv
- Page 107 and 108: Specialized courts Juvenile drug co
- Page 109 and 110: Youth courts Youth courts, also cal
- Page 111 and 112: Record expungement In Illinois, aft
- Page 113 and 114: The Second Judicial Circuit Redeplo
- Page 115 and 116: Models for Change Models for Change
- Page 117 and 118: Map 16 Juvenile justice system init
- Page 119 and 120: is not known how accurate the data
- Page 121 and 122: Further recommendations The recomme
- Page 123 and 124: Automatic transfer (Excluded Jurisd
- Page 125 and 126: Detoxification Discretionary transf
- Page 127 and 128: Job Training Partnership Act (JTPA)
- Page 129 and 130: Property crime index A subcategory
- Page 131 and 132: Appendix B: Map of judicial circuit
- Page 133 and 134: Appendix D: Map of Illinois youth c
- Page 135 and 136: 12 - Homicide, Aggravated Kidnappin
- Page 137 and 138: Offense Offense Offense Offense Cat
- Page 139 and 140: Illinois Department of Corrections
- Page 141: Prevention First 2800 Montvale Driv
- Page 144 and 145: Table 8: Number of reported cases o
- Page 146 and 147: Table 1: Number of services to yout
- Page 148 and 149: Table 2: Number of services to yout
- Page 150 and 151: Table 3: Number of unemployed, FY02
- Page 154 and 155: Table 5: Estimated number of youth
- Page 156 and 157: Table 6: Monthly average number of
- Page 158 and 159: Table 7: Number of reported domesti
- Page 160 and 161: Table 8: Number of reported cases o
- Page 162 and 163: Table 9: Number of indicated cases
- Page 164 and 165: Table 10: Number of reported cases
- Page 166 and 167: Table 11: Number of indicated cases
- Page 168 and 169: Table 12: Number of reported crimes
- Page 170 and 171: Table 13: Number of inmates admitte
- Page 172 and 173: Table 14: Number of students report
- Page 174 and 175: Table 15: Number and sex of truant,
- Page 176 and 177: Table 16: Number of students suspen
- Page 178 and 179: Table 17: Number of students expell
- Page 180 and 181: Table 18: Number of high school dro
- Page 182 and 183: Table 19: Youth population age 10-1
- Page 184 and 185: Table 20: Youth population by race
- Page 186 and 187: Table 21: Number of youth arrests b
- Page 188 and 189: Table 22: Number of youth arrests b
- Page 190 and 191: Table 23: Number of youth arrests b
- Page 192 and 193: Table 24: Number of youth arrests b
- Page 194 and 195: Table 25: Number and type of court
- Page 196 and 197: Table 26: Number and type of youth
- Page 198 and 199: Table 27: Number of delinquency pet
- Page 200 and 201: Table 28: Number of youth (ages 10
- Page 202 and 203:
Table 29: Number of youth admission
- Page 204 and 205:
Table 30: Number of youth admission
- Page 206 and 207:
Table 31: Number of youth admission
- Page 208 and 209:
Table 32: Number of youth admission
- Page 210 and 211:
Table 33: Average daily population
- Page 212 and 213:
Table 34: Number of youth transfers
- Page 214 and 215:
Table 35: Number of active youth fo
- Page 216 and 217:
Table 36: Number of active informal
- Page 218 and 219:
Table 37: Number of youth delinquen
- Page 220 and 221:
Table 38: Number of youth probation
- Page 222 and 223:
Table 39: Number and type of court
- Page 224 and 225:
Table 40: Number and type of youth
- Page 226 and 227:
Table 41: Number and type of youth
- Page 228 and 229:
Table 42: Number and type of youth
- Page 230 and 231:
Table 43: Number of youth (age 13 t
- Page 232 and 233:
Table 44: Number of youth (age 13 t
- Page 234 and 235:
Table 45: Number of youth (age 13 t
- Page 236 and 237:
Table 46: Number of youth released
- Page 238 and 239:
Table 47: Representation index (RI)
- Page 240 and 241:
Table 48: Representation index (RI)
- Page 242 and 243:
Table 49: Representation index (RI)
- Page 244 and 245:
Notes 1 Griffin, Patrick, Linda Szy
- Page 246:
41 Shelden, Randall G., Detention D