Juvenile Justice System and Risk Factor Data - Illinois Criminal ...
Juvenile Justice System and Risk Factor Data - Illinois Criminal ...
Juvenile Justice System and Risk Factor Data - Illinois Criminal ...

Create successful ePaper yourself
Turn your PDF publications into a flip-book with our unique Google optimized e-Paper software.
Calculate the jurisdictional RI using the following formula:<br />
Representation index =<br />
Percent of a minority group at a stage of t he justice process in jurisdiction of interest<br />
Percent of the same minority group in jurisdiction of interest<br />
More explicitly, to calculate the RI for a county’s arrests, use the following formula:<br />
County arrest RI =<br />
Percent of black youth arrests for county<br />
Percent of black youth in county population<br />
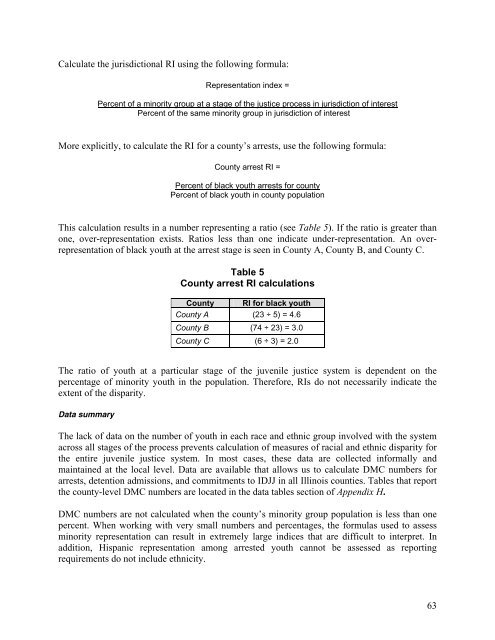
This calculation results in a number representing a ratio (see Table 5). If the ratio is greater than<br />
one, over-representation exists. Ratios less than one indicate under-representation. An overrepresentation<br />
of black youth at the arrest stage is seen in County A, County B, <strong>and</strong> County C.<br />
Table 5<br />
County arrest RI calculations<br />
County RI for black youth<br />
County A (23 ÷ 5) = 4.6<br />
County B (74 ÷ 23) = 3.0<br />
County C (6 ÷ 3) = 2.0<br />
The ratio of youth at a particular stage of the juvenile justice system is dependent on the<br />
percentage of minority youth in the population. Therefore, RIs do not necessarily indicate the<br />
extent of the disparity.<br />
<strong>Data</strong> summary<br />
The lack of data on the number of youth in each race <strong>and</strong> ethnic group involved with the system<br />
across all stages of the process prevents calculation of measures of racial <strong>and</strong> ethnic disparity for<br />
the entire juvenile justice system. In most cases, these data are collected informally <strong>and</strong><br />
maintained at the local level. <strong>Data</strong> are available that allows us to calculate DMC numbers for<br />
arrests, detention admissions, <strong>and</strong> commitments to IDJJ in all <strong>Illinois</strong> counties. Tables that report<br />
the county-level DMC numbers are located in the data tables section of Appendix H.<br />
DMC numbers are not calculated when the county’s minority group population is less than one<br />
percent. When working with very small numbers <strong>and</strong> percentages, the formulas used to assess<br />
minority representation can result in extremely large indices that are difficult to interpret. In<br />
addition, Hispanic representation among arrested youth cannot be assessed as reporting<br />
requirements do not include ethnicity.<br />
63