Juvenile Justice System and Risk Factor Data - Illinois Criminal ...
Juvenile Justice System and Risk Factor Data - Illinois Criminal ...
Juvenile Justice System and Risk Factor Data - Illinois Criminal ...

Create successful ePaper yourself
Turn your PDF publications into a flip-book with our unique Google optimized e-Paper software.
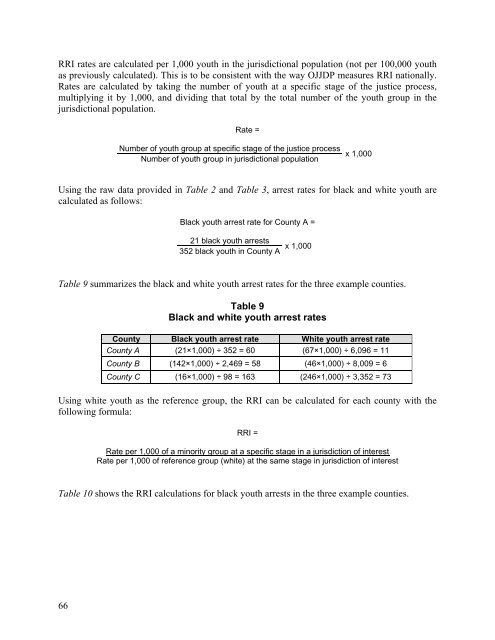
RRI rates are calculated per 1,000 youth in the jurisdictional population (not per 100,000 youth<br />
as previously calculated). This is to be consistent with the way OJJDP measures RRI nationally.<br />
Rates are calculated by taking the number of youth at a specific stage of the justice process,<br />
multiplying it by 1,000, <strong>and</strong> dividing that total by the total number of the youth group in the<br />
jurisdictional population.<br />
Rate =<br />
Number of youth group at specific stage of the justice process<br />
Number of youth group in jurisdictional population<br />
x 1,000<br />
Using the raw data provided in Table 2 <strong>and</strong> Table 3, arrest rates for black <strong>and</strong> white youth are<br />
calculated as follows:<br />
Black youth arrest rate for County A =<br />
21 black youth arrests<br />
352 black youth in County A x 1,000<br />
Table 9 summarizes the black <strong>and</strong> white youth arrest rates for the three example counties.<br />
Table 9<br />
Black <strong>and</strong> white youth arrest rates<br />
County Black youth arrest rate White youth arrest rate<br />
County A (21×1,000) ÷ 352 = 60 (67×1,000) ÷ 6,096 = 11<br />
County B (142×1,000) ÷ 2,469 = 58 (46×1,000) ÷ 8,009 = 6<br />
County C (16×1,000) ÷ 98 = 163 (246×1,000) ÷ 3,352 = 73<br />
Using white youth as the reference group,<br />
following formula:<br />
the RRI can be calculated for each county with the<br />
RRI =<br />
Rate per 1,000 of a minority group at a specific stage in a jurisdiction of interest<br />
Rate per 1,000 of refere nce group (white) at the same stage in jurisdiction of interest<br />
Table 10 shows the RRI calculations for black youth arrests in the three example counties.<br />
66