Juvenile Justice System and Risk Factor Data - Illinois Criminal ...
Juvenile Justice System and Risk Factor Data - Illinois Criminal ...
Juvenile Justice System and Risk Factor Data - Illinois Criminal ...

You also want an ePaper? Increase the reach of your titles
YUMPU automatically turns print PDFs into web optimized ePapers that Google loves.
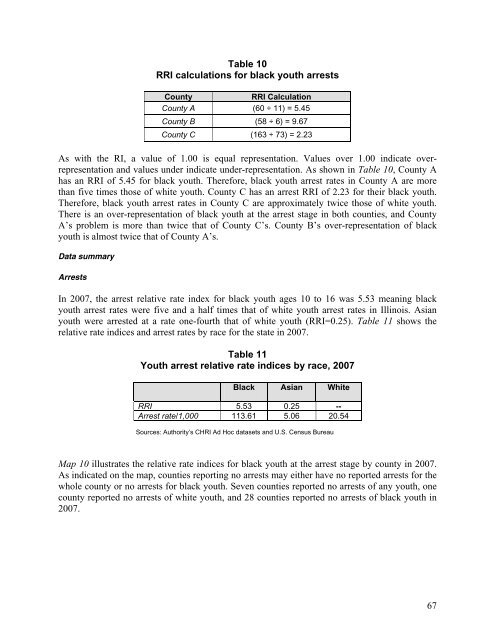
Table 10<br />
RRI calculations for black youth arrests<br />
County<br />
RRI Calculation<br />
County A (60 ÷ 11) = 5.45<br />
County B (58 ÷ 6) = 9.67<br />
Coun ty C (163 ÷ 73) = 2.23<br />
As with the RI, a value of 1.00 is equal representation. Values over 1.00 indicate overrepresentation<br />
<strong>and</strong> values under indicate under-representation. As shown in Table 10, County A<br />
has an RRI of 5.45 for black youth. Therefore, black youth arrest rates in County A are more<br />
than five times those of white youth. County C has an arrest RRI of 2.23 for their black youth.<br />
Therefore, black youth arrest rates in County C are approximately twice those of white youth.<br />
There is an over-representation of black youth at the arrest stage in both counties, <strong>and</strong> County<br />
A’s problem is more than twice that of County C’s. County B’s over-representation of black<br />
youth is almost twice that of County A’s.<br />
<strong>Data</strong> summary<br />
Arrests<br />
In 2007, the arrest relative rate index for black youth ages 10 to 16 was 5.53 meaning black<br />
youth arrest rates were five <strong>and</strong> a half times that of white youth arrest rates in <strong>Illinois</strong>. Asian<br />
youth were arrested at a rate one-fourth that of white youth (RRI=0.25). Table 11 shows the<br />
relative rate indices <strong>and</strong> arrest rates by race for the state in 2007.<br />
Table 11<br />
Youth arrest relative rate indices b y race, 2007<br />
Black Asian White<br />
RRI 5.53 0.25 --<br />
Arrest rate/ 1,000 113.61 5.06 20.54<br />
Sources: Authority’s CHRI Ad Hoc datasets <strong>and</strong> U.S. Census Bureau<br />
Map 10 illustrates the relative rate indices for black youth at the arrest stage by county in 2007.<br />
As indicated on the map, counties reporting no arrests may either have no reported arrests for the<br />
whole county or no arrests for black youth. Seven counties reported no arrests of any youth, one<br />
county reported no arrests of white youth, <strong>and</strong> 28 counties reported no arrests of black youth in<br />
2007.<br />
67