Juvenile Justice System and Risk Factor Data - Illinois Criminal ...
Juvenile Justice System and Risk Factor Data - Illinois Criminal ...
Juvenile Justice System and Risk Factor Data - Illinois Criminal ...

You also want an ePaper? Increase the reach of your titles
YUMPU automatically turns print PDFs into web optimized ePapers that Google loves.
<strong>Data</strong> summary<br />
In 2007, there were 14,154 admissions to secure detention of 10 to 16 year olds statewide, a 22<br />
percent decrease from the 18,226 admissions in 1997, <strong>and</strong> an 11 percent decrease from 15,976 in<br />
2002. In 2007 59 percent of detention admissions were black youth, 28 percent were white<br />
youth, <strong>and</strong> 11 percent were Hispanic youth. JMIS treats the Hispanic ethnicity as a racial<br />
category. Most youth admitted to detention were male (83 percent).<br />
In 2007, 33 percent of admissions to detention for youth ages 10 to 16 were for offenses against<br />
a person. Property offenses accounted for 26 percent of admissions <strong>and</strong> 10 percent were for<br />
outst<strong>and</strong>ing warrants where the offense for which the warrant was issued was unknown. Twentyseven<br />
percent of Cook County detention admissions were for outst<strong>and</strong>ing warrants in which the<br />
offense was unknown. Nine percent of admissions statewide were for drug <strong>and</strong> 7 percent were<br />
for violations of probation, parole, home detention, or court orders. Five percent of admissions<br />
were for offenses designated as “other”, 5 percent were for weapons offenses, 3 percent were for<br />
contempt of court, 2 percent were for sex offenses, <strong>and</strong> 1 percent were for status offenses.<br />
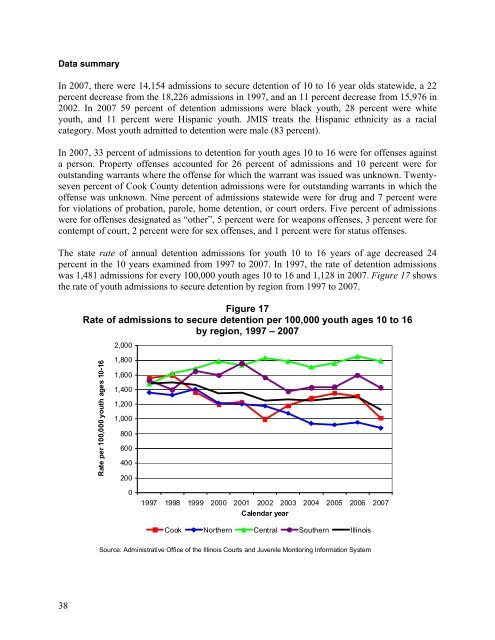
The state rate of annual detention admissions for youth 10 to 16 years of age decreased 24<br />
percent in the 10 years examined from 1997 to 2007. In 1997, the rate of detention admissions<br />
was 1,481 admissions for every 100,000 youth ages 10 to 16 <strong>and</strong> 1,128 in 2007. Figure 17 shows<br />
the rate of youth admissions to secure detention by region from 1997 to 2007.<br />
Rate<br />
Figure 17<br />
of admissions to secure detention per 100,000 youth ages 10 to 16<br />
by region, 1997 – 2007<br />
2,000<br />
er 100,000 youth ages 10-16<br />
Rate p<br />
1,800<br />
1,600<br />
1,400<br />
1,200<br />
1,000<br />
800<br />
600<br />
400<br />
200<br />
0<br />
1997 1998 1999 2000 2001 2002 2003 2004 2005 2006 2007<br />
Calendar year<br />
Cook Northern Central Southern <strong>Illinois</strong><br />
Source: Administrative Office of the <strong>Illinois</strong> Courts <strong>and</strong> <strong>Juvenile</strong> Monitoring Information <strong>System</strong><br />
38