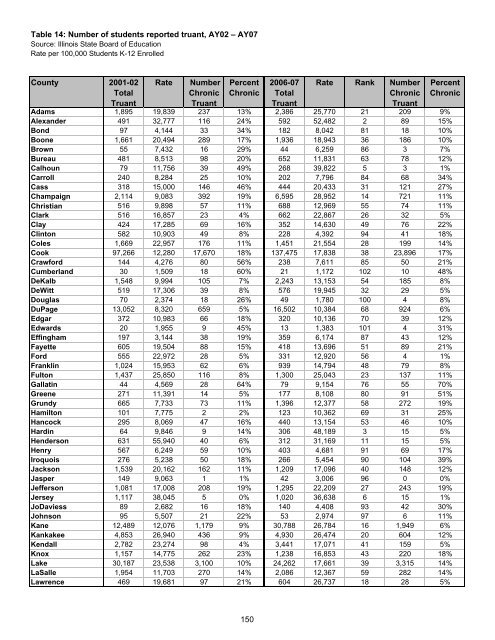
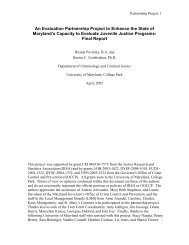
Table 14: Number of students reported truant, AY02 – AY07 Source: <strong>Illinois</strong> State Board of Education Rate per 100,000 Students K-12 Enrolled County 2001-02 Total Truant Rate Number Chronic Truant Percent Chronic 2006-07 Total Truant Rate Rank Number Chronic Truant Percent Chronic Adams 1,895 19,839 237 13% 2,386 25,770 21 209 9% Alex<strong>and</strong>er 491 32,777 116 24% 592 52,482 2 89 15% Bond 97 4,144 33 34% 182 8,042 81 18 10% Boone 1,661 20,494 289 17% 1,936 18,943 36 186 10% Brown 55 7,432 16 29% 44 6,259 86 3 7% Bureau 481 8,513 98 20% 652 11,831 63 78 12% Calhoun 79 11,756 39 49% 268 39,822 5 3 1% Carroll 240 8,284 25 10% 202 7,796 84 68 34% Cass 318 15,000 146 46% 444 20,433 31 121 27% Champaign 2,114 9,083 392 19% 6,595 28,952 14 721 11% Christian 516 9,898 57 11% 688 12,969 55 74 11% Clark 516 16,857 23 4% 662 22,867 26 32 5% Clay 424 17,285 69 16% 352 14,630 49 76 22% Clinton 582 10,903 49 8% 228 4,392 94 41 18% Coles 1,669 22,957 176 11% 1,451 21,554 28 199 14% Cook 97,266 12,280 17,670 18% 137,475 17,838 38 23,896 17% Crawford 144 4,276 80 56% 238 7,611 85 50 21% Cumberl<strong>and</strong> 30 1,509 18 60% 21 1,172 102 10 48% DeKalb 1,548 9,994 105 7% 2,243 13,153 54 185 8% DeWitt 519 17,306 39 8% 576 19,945 32 29 5% Douglas 70 2,374 18 26% 49 1,780 100 4 8% DuPage 13,052 8,320 659 5% 16,502 10,384 68 924 6% Edgar 372 10,983 66 18% 320 10,136 70 39 12% Edwards 20 1,955 9 45% 13 1,383 101 4 31% Effingham 197 3,144 38 19% 359 6,174 87 43 12% Fayette 605 19,504 88 15% 418 13,696 51 89 21% Ford 555 22,972 28 5% 331 12,920 56 4 1% Franklin 1,024 15,953 62 6% 939 14,794 48 79 8% Fulton 1,437 25,850 116 8% 1,300 25,043 23 137 11% Gallatin 44 4,569 28 64% 79 9,154 76 55 70% Greene 271 11,391 14 5% 177 8,108 80 91 51% Grundy 665 7,733 73 11% 1,396 12,377 58 272 19% Hamilton 101 7,775 2 2% 123 10,362 69 31 25% Hancock 295 8,069 47 16% 440 13,154 53 46 10% Hardin 64 9,846 9 14% 306 48,189 3 15 5% Henderson 631 55,940 40 6% 312 31,169 11 15 5% Henry 567 6,249 59 10% 403 4,681 91 69 17% Iroquois 276 5,238 50 18% 266 5,454 90 104 39% Jackson 1,539 20,162 162 11% 1,209 17,096 40 148 12% Jasper 149 9,063 1 1% 42 3,006 96 0 0% Jefferson 1,081 17,008 208 19% 1,295 22,209 27 243 19% Jersey 1,117 38,045 5 0% 1,020 36,638 6 15 1% JoDaviess 89 2,682 16 18% 140 4,408 93 42 30% Johnson 95 5,507 21 22% 53 2,974 97 6 11% Kane 12,489 12,076 1,179 9% 30,788 26,784 16 1,949 6% Kankakee 4,853 26,940 436 9% 4,930 26,474 20 604 12% Kendall 2,782 23,274 98 4% 3,441 17,071 41 159 5% Knox 1,157 14,775 262 23% 1,238 16,853 43 220 18% Lake 30,187 23,538 3,100 10% 24,262 17,661 39 3,315 14% LaSalle 1,954 11,703 270 14% 2,086 12,367 59 282 14% Lawrence 469 19,681 97 21% 604 26,737 18 28 5% 150
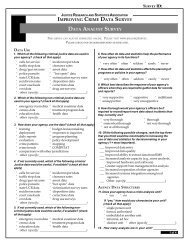
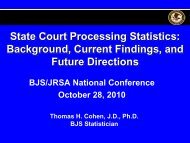
Table 14: Number of students reported truant, AY02 – AY07 County 2001-02 Total Truant Rate Number Chronic Truant Percent Chronic 2006-07 Total Truant Rate Rank Number Chronic Truant Percent Chronic Lee 418 7,959 30 7% 1,246 25,501 22 168 13% Livingston 668 9,221 46 7% 881 12,438 57 39 4% Logan 484 12,900 109 23% 421 12,032 61 97 23% McDonough 636 16,719 39 6% 633 18,958 35 85 13% McHenry 4,016 8,810 213 5% 5,032 9,585 73 281 6% McLean 2,537 10,575 143 6% 1,992 8,727 79 213 11% Macon 1,437 8,160 186 13% 6,805 41,295 4 656 10% Macoupin 558 5,987 125 22% 1,316 14,963 47 110 8% Madison 7,782 18,540 1,561 20% 13,459 32,169 8 1,563 12% Marion 963 12,551 176 18% 732 10,090 71 151 21% Marshall 50 3,195 9 18% 155 11,032 67 12 8% Mason 277 8,259 71 26% 506 16,208 44 100 20% Massac 454 18,737 38 8% 494 19,808 33 30 6% Menard 153 5,905 26 17% 221 8,918 78 87 39% Mercer 119 7,599 1 1% 172 11,994 62 4 2% Monroe 555 11,884 16 3% 223 4,471 92 45 20% Montgomery 520 10,488 44 8% 362 7,940 82 70 19% Morgan 828 15,399 123 15% 562 11,276 64 96 17% Moultrie 216 10,800 10 5% 279 14,206 50 26 9% Ogle 1,062 10,426 53 5% 1,144 11,163 66 95 8% Peoria 6,173 21,955 1,180 19% 8,918 31,644 10 1,045 12% Perry 230 7,888 29 13% 281 9,950 72 25 9% Piatt 81 2,425 10 12% 93 2,874 98 2 2% Pike 792 27,692 66 8% 790 29,958 12 98 12% Pope 0 0 0 0% 63 12,115 60 4 6% Pulaski 560 41,916 43 8% 359 34,321 7 79 22% Putnam 146 15,208 11 8% 55 6,044 88 15 27% R<strong>and</strong>olph 771 17,218 111 14% 871 21,039 30 109 13% Richl<strong>and</strong> 754 28,229 49 6% 560 22,932 25 19 3% Rock Isl<strong>and</strong> 3,738 15,792 605 16% 6,125 27,129 15 976 16% St. Clair 7,492 16,925 1,694 23% 8,145 18,733 37 2,696 33% Saline 722 17,364 105 15% 843 21,049 29 71 8% Sangamon 6,469 22,949 1,528 24% 7,356 26,518 19 1,074 15% Schuyler 80 7,619 0 0% 69 5,551 89 2 3% Scott 96 9,543 32 33% 141 15,825 45 35 25% Shelby 695 17,730 34 5% 324 9,465 75 22 7% Stark 29 2,680 6 21% 34 2,808 99 11 32% Stephenson 1,840 24,230 153 8% 1,878 26,760 17 238 13% Tazewell 1,038 5,320 105 10% 1,846 9,467 74 173 9% Union 607 18,851 37 6% 252 7,932 83 52 21% Vermilion 1,966 14,307 363 18% 4,329 31,810 9 706 16% Wabash 205 10,199 38 19% 281 15,431 46 93 33% Warren 377 13,031 39 10% 284 11,221 65 86 30% Washington 168 7,675 10 6% 263 13,216 52 10 4% Wayne 129 4,821 23 18% 101 3,980 95 31 31% White 388 14,764 65 17% 408 16,965 42 51 13% Whiteside 1,345 13,499 104 8% 2,772 29,555 13 118 4% Will 5,085 5,942 554 11% 26,265 23,803 24 1,785 7% Williamson 2,551 27,398 150 6% 1,855 19,475 34 198 11% Winnebago 18,835 43,376 2,473 13% 25,032 54,551 1 2,203 9% Woodford 304 4,127 57 19% 713 9,020 77 77 11% State/Regional programs 1,743 N/A 485 28% 2,041 18,578 789 0% Total 277,994 13,894 40,116 14% 392,058 19,190 51,941 13% 151
- Page 1:
State of Illinois Pat Quinn, Govern
- Page 4 and 5:
Acknowledgments We wish to acknowle
- Page 6 and 7:
State initiatives .................
- Page 8 and 9:
Table 18: Number and percentage of
- Page 10 and 11:
Figure 16: Rate of youth adjudicate
- Page 13 and 14:
Foreword The Illinois Criminal Just
- Page 15 and 16:
Poverty In calendar year 2007, 524,
- Page 17 and 18:
Illinois juvenile justice system da
- Page 19 and 20:
Special issues Disproportionate min
- Page 21 and 22:
Youth courts Youth courts, also cal
- Page 23 and 24:
Introduction Since 2003, the Illino
- Page 25 and 26:
The Juvenile Justice System and Ris
- Page 27 and 28:
Figure 1 Flowchart of the Illinois
- Page 29 and 30:
Table 1 Legislative changes from th
- Page 31 and 32:
• Competency development. Restora
- Page 33 and 34:
Community risk factors Community ri
- Page 35 and 36:
Education In 2000, the most recent
- Page 37 and 38:
Social context The data elements ex
- Page 39 and 40:
neglect. That year, 28,516 cases of
- Page 41 and 42:
Correctional inmates with children
- Page 43 and 44:
Chronic truants are students who ha
- Page 45 and 46:
Expulsions During AY07, 3,451 stude
- Page 47 and 48:
important protective factors agains
- Page 49 and 50:
An alternate source for youth arres
- Page 51 and 52:
Arrest data by offense category is
- Page 53 and 54:
Court data After being arrested a y
- Page 55 and 56:
Map 2 P ercent change in rate of ne
- Page 57 and 58:
Map 3 Percent change in rate of you
- Page 59 and 60:
Detention data information Data col
- Page 61 and 62:
The Central region of Illinois expe
- Page 63 and 64:
Transfers to criminal court Youth 1
- Page 65 and 66:
Map 5 Number of detained youth tran
- Page 67 and 68:
The rate of formal probation cases
- Page 69 and 70:
Informal probation caseloads The nu
- Page 71 and 72:
Delinquency petitions continued und
- Page 73 and 74:
Map 8 Percent change in rate of you
- Page 75 and 76:
adult would. Mandatory supervised r
- Page 77 and 78:
Map 9 Percent change in rate of you
- Page 79 and 80:
Of court commitments in FY07, 28 pe
- Page 81 and 82:
2004, increasing 28 percent from 1,
- Page 83 and 84:
Special issues Disproportionate min
- Page 85 and 86:
Calculate the jurisdictional RI usi
- Page 87 and 88:
under-represented at 52 percent les
- Page 89 and 90:
Table 10 RRI calculations for black
- Page 91 and 92:
Detention In 2007, the rates of adm
- Page 93 and 94:
Map 12 Hispanic youth detention rel
- Page 95 and 96:
Map 13 Black youth IDJJ relative ra
- Page 97 and 98:
Table 14 provides a statewide overv
- Page 99 and 100:
From 1997 to 2007, there was a 65 p
- Page 101 and 102:
Table 17 shows the number of youth
- Page 103 and 104:
Females in secure detention Females
- Page 105 and 106:
screening after referral from a juv
- Page 107 and 108:
Specialized courts Juvenile drug co
- Page 109 and 110:
Youth courts Youth courts, also cal
- Page 111 and 112:
Record expungement In Illinois, aft
- Page 113 and 114:
The Second Judicial Circuit Redeplo
- Page 115 and 116:
Models for Change Models for Change
- Page 117 and 118:
Map 16 Juvenile justice system init
- Page 119 and 120:
is not known how accurate the data
- Page 121 and 122: Further recommendations The recomme
- Page 123 and 124: Automatic transfer (Excluded Jurisd
- Page 125 and 126: Detoxification Discretionary transf
- Page 127 and 128: Job Training Partnership Act (JTPA)
- Page 129 and 130: Property crime index A subcategory
- Page 131 and 132: Appendix B: Map of judicial circuit
- Page 133 and 134: Appendix D: Map of Illinois youth c
- Page 135 and 136: 12 - Homicide, Aggravated Kidnappin
- Page 137 and 138: Offense Offense Offense Offense Cat
- Page 139 and 140: Illinois Department of Corrections
- Page 141: Prevention First 2800 Montvale Driv
- Page 144 and 145: Table 8: Number of reported cases o
- Page 146 and 147: Table 1: Number of services to yout
- Page 148 and 149: Table 2: Number of services to yout
- Page 150 and 151: Table 3: Number of unemployed, FY02
- Page 152 and 153: Table 4: Estimated median household
- Page 154 and 155: Table 5: Estimated number of youth
- Page 156 and 157: Table 6: Monthly average number of
- Page 158 and 159: Table 7: Number of reported domesti
- Page 160 and 161: Table 8: Number of reported cases o
- Page 162 and 163: Table 9: Number of indicated cases
- Page 164 and 165: Table 10: Number of reported cases
- Page 166 and 167: Table 11: Number of indicated cases
- Page 168 and 169: Table 12: Number of reported crimes
- Page 170 and 171: Table 13: Number of inmates admitte
- Page 174 and 175: Table 15: Number and sex of truant,
- Page 176 and 177: Table 16: Number of students suspen
- Page 178 and 179: Table 17: Number of students expell
- Page 180 and 181: Table 18: Number of high school dro
- Page 182 and 183: Table 19: Youth population age 10-1
- Page 184 and 185: Table 20: Youth population by race
- Page 186 and 187: Table 21: Number of youth arrests b
- Page 188 and 189: Table 22: Number of youth arrests b
- Page 190 and 191: Table 23: Number of youth arrests b
- Page 192 and 193: Table 24: Number of youth arrests b
- Page 194 and 195: Table 25: Number and type of court
- Page 196 and 197: Table 26: Number and type of youth
- Page 198 and 199: Table 27: Number of delinquency pet
- Page 200 and 201: Table 28: Number of youth (ages 10
- Page 202 and 203: Table 29: Number of youth admission
- Page 204 and 205: Table 30: Number of youth admission
- Page 206 and 207: Table 31: Number of youth admission
- Page 208 and 209: Table 32: Number of youth admission
- Page 210 and 211: Table 33: Average daily population
- Page 212 and 213: Table 34: Number of youth transfers
- Page 214 and 215: Table 35: Number of active youth fo
- Page 216 and 217: Table 36: Number of active informal
- Page 218 and 219: Table 37: Number of youth delinquen
- Page 220 and 221: Table 38: Number of youth probation
- Page 222 and 223:
Table 39: Number and type of court
- Page 224 and 225:
Table 40: Number and type of youth
- Page 226 and 227:
Table 41: Number and type of youth
- Page 228 and 229:
Table 42: Number and type of youth
- Page 230 and 231:
Table 43: Number of youth (age 13 t
- Page 232 and 233:
Table 44: Number of youth (age 13 t
- Page 234 and 235:
Table 45: Number of youth (age 13 t
- Page 236 and 237:
Table 46: Number of youth released
- Page 238 and 239:
Table 47: Representation index (RI)
- Page 240 and 241:
Table 48: Representation index (RI)
- Page 242 and 243:
Table 49: Representation index (RI)
- Page 244 and 245:
Notes 1 Griffin, Patrick, Linda Szy
- Page 246:
41 Shelden, Randall G., Detention D