Juvenile Justice System and Risk Factor Data - Illinois Criminal ...
Juvenile Justice System and Risk Factor Data - Illinois Criminal ...
Juvenile Justice System and Risk Factor Data - Illinois Criminal ...

Create successful ePaper yourself
Turn your PDF publications into a flip-book with our unique Google optimized e-Paper software.
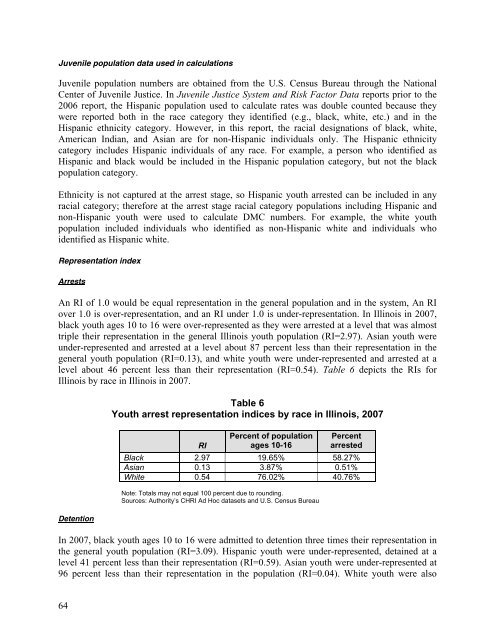
<strong>Juvenile</strong> population data used in calculations<br />
<strong>Juvenile</strong> population numbers are obtained from the U.S. Census Bureau through the National<br />
Center of <strong>Juvenile</strong> <strong>Justice</strong>. In <strong>Juvenile</strong> <strong>Justice</strong> <strong>System</strong> <strong>and</strong> <strong>Risk</strong> <strong>Factor</strong> <strong>Data</strong> reports prior to the<br />
2006 report, the Hispanic population used to calculate rates was double counted because they<br />
were reported both in the race category they identified (e.g., black, white, etc.) <strong>and</strong> in the<br />
Hispanic ethnicity category. However, in this report, the racial designations of black, white,<br />
American Indian, <strong>and</strong> Asian are for non-Hispanic individuals only. The Hispanic ethnicity<br />
category includes Hispanic individuals of any race. For example, a person who identified as<br />
Hispanic <strong>and</strong> black would be included in t he Hispanic population category, but not the black<br />
population category.<br />
Ethnicity is not captured at the arrest stage, so Hispanic youth arrested can be included in any<br />
racial category; therefore at the arrest stage racial category populations including Hispanic <strong>and</strong><br />
non-Hispanic youth were used to calculate DMC numbers. For example, the white youth<br />
population included individuals who identified as non-Hispanic white <strong>and</strong> individuals who<br />
identified as Hispanic white.<br />
Representation index<br />
Arrests<br />
An RI of 1.0 would be equal representation in the general population <strong>and</strong> in the system, An RI<br />
over 1.0 is over-rep resentation, <strong>and</strong> an RI under 1.0 is under-repres entation. In <strong>Illinois</strong> in 2007,<br />
black y outh ages 10 to 16 were o ver-represented as they were arrested at a level that<br />
was almost<br />
triple their representation in the general <strong>Illinois</strong> youth population (RI=2.97). Asian youth were<br />
under-represented <strong>and</strong> arrested at a level about 87 percent less than their representation in the<br />
general youth population (RI=0.13), <strong>and</strong> white youth were under-represented <strong>and</strong> arrested at a<br />
level about 46 percent less than their representation (RI=0.54). Table 6 depicts the RIs for<br />
<strong>Illinois</strong> by race in <strong>Illinois</strong> in 2007.<br />
Detention<br />
Table 6<br />
Youth arrest representation indices by race in <strong>Illinois</strong>, 2007<br />
Percent of population Percent<br />
RI<br />
ages 10-16 arrested<br />
Black 2.97 19.65% 58.27%<br />
Asian 0.13 3.87% 0.51%<br />
White 0.54 76.02% 40.76%<br />
Note: Totals may not equal 100 percent due to rounding.<br />
Sources: Authority’s CHRI Ad Hoc datasets <strong>and</strong> U.S. Census Bureau<br />
In 2007, black youth ages 10 to 16 were admitted to dete ntion three times their representation in<br />
the general youth population (RI=3.09). Hispanic youth were under-represented, detained at a<br />
level 41 percent less than their representation (RI=0.59). Asian youth were under-represented at<br />
96 percent less than their representation in the population (RI=0.04). White youth were also<br />
64