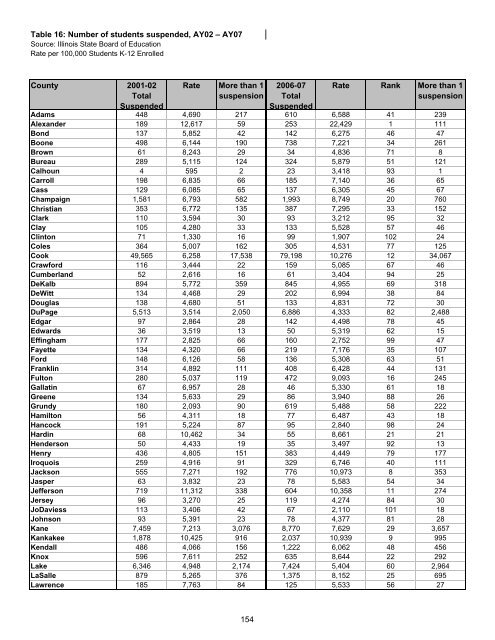
Table 16: Number of students suspended, AY02 – AY07 Source: <strong>Illinois</strong> State Board of Education Rate per 100,000 Students K-12 Enrolled County 2001-02 Total Suspended Rate More than 1 suspension 2006-07 Total Suspended Rate Rank More than 1 suspension Adams 448 4,690 217 610 6,588 41 239 Alex<strong>and</strong>er 189 12,617 59 253 22,429 1 111 Bond 137 5,852 42 142 6,275 46 47 Boone 498 6,144 190 738 7,221 34 261 Brown 61 8,243 29 34 4,836 71 8 Bureau 289 5,115 124 324 5,879 51 121 Calhoun 4 595 2 23 3,418 93 1 Carroll 198 6,835 66 185 7,140 36 65 Cass 129 6,085 65 137 6,305 45 67 Champaign 1,581 6,793 582 1,993 8,749 20 760 Christian 353 6,772 135 387 7,295 33 152 Clark 110 3,594 30 93 3,212 95 32 Clay 105 4,280 33 133 5,528 57 46 Clinton 71 1,330 16 99 1,907 102 24 Coles 364 5,007 162 305 4,531 77 125 Cook 49,565 6,258 17,538 79,198 10,276 12 34,067 Crawford 116 3,444 22 159 5,085 67 46 Cumberl<strong>and</strong> 52 2,616 16 61 3,404 94 25 DeKalb 894 5,772 359 845 4,955 69 318 DeWitt 134 4,468 29 202 6,994 38 84 Douglas 138 4,680 51 133 4,831 72 30 DuPage 5,513 3,514 2,050 6,886 4,333 82 2,488 Edgar 97 2,864 28 142 4,498 78 45 Edwards 36 3,519 13 50 5,319 62 15 Effingham 177 2,825 66 160 2,752 99 47 Fayette 134 4,320 66 219 7,176 35 107 Ford 148 6,126 58 136 5,308 63 51 Franklin 314 4,892 111 408 6,428 44 131 Fulton 280 5,037 119 472 9,093 16 245 Gallatin 67 6,957 28 46 5,330 61 18 Greene 134 5,633 29 86 3,940 88 26 Grundy 180 2,093 90 619 5,488 58 222 Hamilton 56 4,311 18 77 6,487 43 18 Hancock 191 5,224 87 95 2,840 98 24 Hardin 68 10,462 34 55 8,661 21 21 Henderson 50 4,433 19 35 3,497 92 13 Henry 436 4,805 151 383 4,449 79 177 Iroquois 259 4,916 91 329 6,746 40 111 Jackson 555 7,271 192 776 10,973 8 353 Jasper 63 3,832 23 78 5,583 54 34 Jefferson 719 11,312 338 604 10,358 11 274 Jersey 96 3,270 25 119 4,274 84 30 JoDaviess 113 3,406 42 67 2,110 101 18 Johnson 93 5,391 23 78 4,377 81 28 Kane 7,459 7,213 3,076 8,770 7,629 29 3,657 Kankakee 1,878 10,425 916 2,037 10,939 9 995 Kendall 486 4,066 156 1,222 6,062 48 456 Knox 596 7,611 252 635 8,644 22 292 Lake 6,346 4,948 2,174 7,424 5,404 60 2,964 LaSalle 879 5,265 376 1,375 8,152 25 695 Lawrence 185 7,763 84 125 5,533 56 27 154
Table 16: Number of students suspended, AY02 – AY07 County 2001-02 Total Suspended Rate More than 1 suspension 2006-07 Total Suspended Rate Rank More than 1 suspension Lee 202 3,846 87 444 9,087 17 214 Livingston 390 5,384 145 404 5,704 53 148 Logan 232 6,183 94 274 7,831 28 132 McDonough 160 4,206 59 263 7,877 27 109 McHenry 1,914 4,199 815 2,310 4,400 80 822 McLean 1,097 4,573 438 1,196 5,239 65 491 Macon 2,277 12,929 1,204 2,323 14,097 5 1,204 Macoupin 426 4,571 137 424 4,821 73 132 Madison 3,766 8,972 1,614 3,841 9,181 15 1,578 Marion 485 6,321 191 530 7,305 32 189 Marshall 78 4,984 28 85 6,050 50 29 Mason 142 4,234 44 159 5,093 66 63 Massac 238 9,823 112 232 9,302 14 75 Menard 108 4,168 33 89 3,592 91 35 Mercer 74 4,725 25 66 4,603 76 23 Monroe 189 4,047 72 114 2,285 100 25 Montgomery 364 7,342 196 378 8,291 24 203 Morgan 146 2,715 41 249 4,996 68 107 Moultrie 75 3,750 22 81 4,124 85 30 Ogle 386 3,790 133 602 5,874 52 199 Peoria 4,464 15,877 2,319 4,274 15,166 3 2,295 Perry 82 2,812 22 106 3,754 89 27 Piatt 126 3,772 46 99 3,059 97 27 Pike 123 4,301 56 146 5,537 55 59 Pope 39 6,566 29 25 4,808 74 10 Pulaski 274 20,509 156 134 12,811 6 43 Putnam 44 4,583 25 48 5,275 64 13 R<strong>and</strong>olph 155 3,461 35 179 4,324 83 39 Richl<strong>and</strong> 177 6,627 73 117 4,791 75 35 Rock Isl<strong>and</strong> 2,423 10,237 1,158 2,028 8,983 18 915 St. Clair 6,054 13,676 3,189 7,729 17,776 2 3,783 Saline 223 5,363 71 246 6,142 47 79 Sangamon 2,716 9,635 1,168 2,981 10,746 10 1,408 Schuyler 81 7,714 34 91 7,321 31 42 Scott 57 5,666 7 54 6,061 49 22 Shelby 243 6,199 92 138 4,032 86 58 Stark 53 4,898 16 84 6,936 39 22 Stephenson 760 10,008 353 653 9,305 13 328 Tazewell 1,051 5,387 446 1,390 7,128 37 665 Union 154 4,783 39 279 8,782 19 106 Vermilion 1,046 7,612 523 1,648 12,110 7 705 Wabash 81 4,030 29 137 7,523 30 71 Warren 226 7,812 104 137 5,413 59 46 Washington 82 3,746 25 74 3,719 90 19 Wayne 100 3,737 29 167 6,580 42 59 White 107 4,072 23 76 3,160 96 24 Whiteside 573 5,751 227 454 4,841 70 189 Will 6,225 7,274 2,479 8,898 8,064 26 3,740 Williamson 545 5,853 140 794 8,336 23 283 Winnebago 7,033 16,196 3,969 6,848 14,924 4 3,652 Woodford 234 3,176 88 317 4,010 87 113 State/Regional Schools 791 6,272 311 953 8,675 414 Total 132,135 6,604 53,273 174,930 8,562 75,310 155
- Page 1:
State of Illinois Pat Quinn, Govern
- Page 4 and 5:
Acknowledgments We wish to acknowle
- Page 6 and 7:
State initiatives .................
- Page 8 and 9:
Table 18: Number and percentage of
- Page 10 and 11:
Figure 16: Rate of youth adjudicate
- Page 13 and 14:
Foreword The Illinois Criminal Just
- Page 15 and 16:
Poverty In calendar year 2007, 524,
- Page 17 and 18:
Illinois juvenile justice system da
- Page 19 and 20:
Special issues Disproportionate min
- Page 21 and 22:
Youth courts Youth courts, also cal
- Page 23 and 24:
Introduction Since 2003, the Illino
- Page 25 and 26:
The Juvenile Justice System and Ris
- Page 27 and 28:
Figure 1 Flowchart of the Illinois
- Page 29 and 30:
Table 1 Legislative changes from th
- Page 31 and 32:
• Competency development. Restora
- Page 33 and 34:
Community risk factors Community ri
- Page 35 and 36:
Education In 2000, the most recent
- Page 37 and 38:
Social context The data elements ex
- Page 39 and 40:
neglect. That year, 28,516 cases of
- Page 41 and 42:
Correctional inmates with children
- Page 43 and 44:
Chronic truants are students who ha
- Page 45 and 46:
Expulsions During AY07, 3,451 stude
- Page 47 and 48:
important protective factors agains
- Page 49 and 50:
An alternate source for youth arres
- Page 51 and 52:
Arrest data by offense category is
- Page 53 and 54:
Court data After being arrested a y
- Page 55 and 56:
Map 2 P ercent change in rate of ne
- Page 57 and 58:
Map 3 Percent change in rate of you
- Page 59 and 60:
Detention data information Data col
- Page 61 and 62:
The Central region of Illinois expe
- Page 63 and 64:
Transfers to criminal court Youth 1
- Page 65 and 66:
Map 5 Number of detained youth tran
- Page 67 and 68:
The rate of formal probation cases
- Page 69 and 70:
Informal probation caseloads The nu
- Page 71 and 72:
Delinquency petitions continued und
- Page 73 and 74:
Map 8 Percent change in rate of you
- Page 75 and 76:
adult would. Mandatory supervised r
- Page 77 and 78:
Map 9 Percent change in rate of you
- Page 79 and 80:
Of court commitments in FY07, 28 pe
- Page 81 and 82:
2004, increasing 28 percent from 1,
- Page 83 and 84:
Special issues Disproportionate min
- Page 85 and 86:
Calculate the jurisdictional RI usi
- Page 87 and 88:
under-represented at 52 percent les
- Page 89 and 90:
Table 10 RRI calculations for black
- Page 91 and 92:
Detention In 2007, the rates of adm
- Page 93 and 94:
Map 12 Hispanic youth detention rel
- Page 95 and 96:
Map 13 Black youth IDJJ relative ra
- Page 97 and 98:
Table 14 provides a statewide overv
- Page 99 and 100:
From 1997 to 2007, there was a 65 p
- Page 101 and 102:
Table 17 shows the number of youth
- Page 103 and 104:
Females in secure detention Females
- Page 105 and 106:
screening after referral from a juv
- Page 107 and 108:
Specialized courts Juvenile drug co
- Page 109 and 110:
Youth courts Youth courts, also cal
- Page 111 and 112:
Record expungement In Illinois, aft
- Page 113 and 114:
The Second Judicial Circuit Redeplo
- Page 115 and 116:
Models for Change Models for Change
- Page 117 and 118:
Map 16 Juvenile justice system init
- Page 119 and 120:
is not known how accurate the data
- Page 121 and 122:
Further recommendations The recomme
- Page 123 and 124:
Automatic transfer (Excluded Jurisd
- Page 125 and 126: Detoxification Discretionary transf
- Page 127 and 128: Job Training Partnership Act (JTPA)
- Page 129 and 130: Property crime index A subcategory
- Page 131 and 132: Appendix B: Map of judicial circuit
- Page 133 and 134: Appendix D: Map of Illinois youth c
- Page 135 and 136: 12 - Homicide, Aggravated Kidnappin
- Page 137 and 138: Offense Offense Offense Offense Cat
- Page 139 and 140: Illinois Department of Corrections
- Page 141: Prevention First 2800 Montvale Driv
- Page 144 and 145: Table 8: Number of reported cases o
- Page 146 and 147: Table 1: Number of services to yout
- Page 148 and 149: Table 2: Number of services to yout
- Page 150 and 151: Table 3: Number of unemployed, FY02
- Page 152 and 153: Table 4: Estimated median household
- Page 154 and 155: Table 5: Estimated number of youth
- Page 156 and 157: Table 6: Monthly average number of
- Page 158 and 159: Table 7: Number of reported domesti
- Page 160 and 161: Table 8: Number of reported cases o
- Page 162 and 163: Table 9: Number of indicated cases
- Page 164 and 165: Table 10: Number of reported cases
- Page 166 and 167: Table 11: Number of indicated cases
- Page 168 and 169: Table 12: Number of reported crimes
- Page 170 and 171: Table 13: Number of inmates admitte
- Page 172 and 173: Table 14: Number of students report
- Page 174 and 175: Table 15: Number and sex of truant,
- Page 178 and 179: Table 17: Number of students expell
- Page 180 and 181: Table 18: Number of high school dro
- Page 182 and 183: Table 19: Youth population age 10-1
- Page 184 and 185: Table 20: Youth population by race
- Page 186 and 187: Table 21: Number of youth arrests b
- Page 188 and 189: Table 22: Number of youth arrests b
- Page 190 and 191: Table 23: Number of youth arrests b
- Page 192 and 193: Table 24: Number of youth arrests b
- Page 194 and 195: Table 25: Number and type of court
- Page 196 and 197: Table 26: Number and type of youth
- Page 198 and 199: Table 27: Number of delinquency pet
- Page 200 and 201: Table 28: Number of youth (ages 10
- Page 202 and 203: Table 29: Number of youth admission
- Page 204 and 205: Table 30: Number of youth admission
- Page 206 and 207: Table 31: Number of youth admission
- Page 208 and 209: Table 32: Number of youth admission
- Page 210 and 211: Table 33: Average daily population
- Page 212 and 213: Table 34: Number of youth transfers
- Page 214 and 215: Table 35: Number of active youth fo
- Page 216 and 217: Table 36: Number of active informal
- Page 218 and 219: Table 37: Number of youth delinquen
- Page 220 and 221: Table 38: Number of youth probation
- Page 222 and 223: Table 39: Number and type of court
- Page 224 and 225: Table 40: Number and type of youth
- Page 226 and 227:
Table 41: Number and type of youth
- Page 228 and 229:
Table 42: Number and type of youth
- Page 230 and 231:
Table 43: Number of youth (age 13 t
- Page 232 and 233:
Table 44: Number of youth (age 13 t
- Page 234 and 235:
Table 45: Number of youth (age 13 t
- Page 236 and 237:
Table 46: Number of youth released
- Page 238 and 239:
Table 47: Representation index (RI)
- Page 240 and 241:
Table 48: Representation index (RI)
- Page 242 and 243:
Table 49: Representation index (RI)
- Page 244 and 245:
Notes 1 Griffin, Patrick, Linda Szy
- Page 246:
41 Shelden, Randall G., Detention D