Juvenile Justice System and Risk Factor Data - Illinois Criminal ...
Juvenile Justice System and Risk Factor Data - Illinois Criminal ...
Juvenile Justice System and Risk Factor Data - Illinois Criminal ...

Create successful ePaper yourself
Turn your PDF publications into a flip-book with our unique Google optimized e-Paper software.
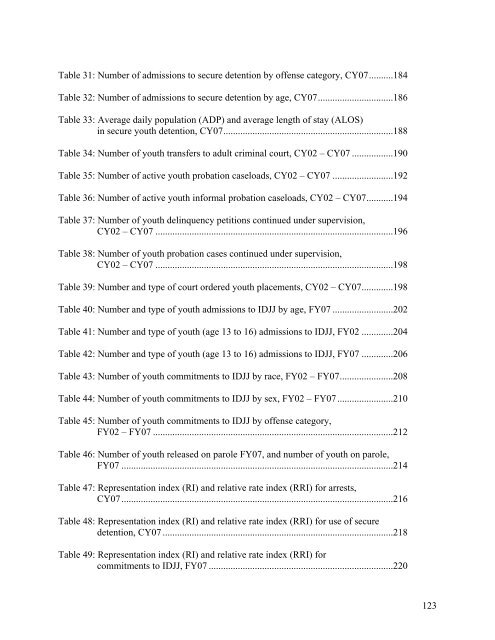
Table 31: Number of admissions to secure detention by offense category, CY07..........184<br />
Table 32: Number of admissions to secure detention by age, CY07...............................186<br />
Table 33: Average daily population (ADP) <strong>and</strong> average length of stay (ALOS)<br />
in secure youth detention, CY07......................................................................188<br />
Table 34: Number of youth transfers to adult criminal court, CY02 – CY07 .................190<br />
Table 35: Number of active youth probation caseloads, CY02 – CY07 .........................192<br />
Table 36: Number of active youth informal probation caseloads, CY02 – CY07...........194<br />
Table 37: Number of youth delinquency petitions continued under supervision,<br />
CY02 – CY07 ..................................................................................................196<br />
Table 38: Number of youth probation cases continued under supervision,<br />
CY02 – CY07 ..................................................................................................198<br />
Table 39: Number <strong>and</strong> type of court ordered youth placements, CY02 – CY07.............198<br />
Table 40: Number <strong>and</strong> type of youth admissions to IDJJ by age, FY07 .........................202<br />
Table 41: Number <strong>and</strong> type of youth (age 13 to 16) admissions to IDJJ, FY02 .............204<br />
Table 42: Number <strong>and</strong> type of youth (age 13 to 16) admissions to IDJJ, FY07 .............206<br />
Table 43: Number of youth commitments to IDJJ by race, FY02 – FY07......................208<br />
Table 44: Number of youth commitments to IDJJ by sex, FY02 – FY07.......................210<br />
Table 45: Number of youth commitments to IDJJ by offense category,<br />
FY02 – FY07 ...................................................................................................212<br />
Table 46: Number of youth released on parole FY07, <strong>and</strong> number of youth on parole,<br />
FY07 ................................................................................................................214<br />
Table 47: Representation index (RI) <strong>and</strong> relative rate index (RRI) for arrests,<br />
CY07................................................................................................................216<br />
Table 48: Representation index (RI) <strong>and</strong> relative rate index (RRI) for use of secure<br />
detention, CY07 ...............................................................................................218<br />
Table 49: Representation index (RI) <strong>and</strong> relative rate index (RRI) for<br />
commitments to IDJJ, FY07 ............................................................................220<br />
123