CLIOwin 7 PCI User's Manual - Audiomatica
CLIOwin 7 PCI User's Manual - Audiomatica
CLIOwin 7 PCI User's Manual - Audiomatica

You also want an ePaper? Increase the reach of your titles
YUMPU automatically turns print PDFs into web optimized ePapers that Google loves.
utton. Any process you execute can be saved to disk and will have "mpro" extension.<br />
This allows you to recall any value or file path later on by loading this file again. Suppose<br />
you have a small production of ten speakers that you want to test against a previous<br />
produced reference which you know is fine. You just have to define and save a process<br />
that divides the current data with the reference. Testing a device against itself should<br />
produce a flat line, within the frequency range of the device, and this should be checked<br />
before saving the process. When you need to check your batch you just recall your<br />
process. This will activate the Automatic Process button. When this button is activated<br />
any subsequent measurement is processed before it is displayed. The next process we<br />
will consider is the dBSPL/Watt. It requires a file and an impedance value and allows<br />
us to obtain a frequency response plot referred to 1W at the speaker terminal whatever<br />
the real measurement level is. To make this possible an electrical measurement at the<br />
speaker terminal (power amplifier output) must be taken, with dBV as y-scale, and used<br />
as a reference file. A value of impedance is also necessary that allows CLIO to convert<br />
voltage to power. We will go through the entire procedure using the tweeter of the<br />
previous examples. Since what we are looking for is the response in a 1W-1m condition<br />
we have to move the microphone to a distance of 1m from the tweeter (it was at<br />
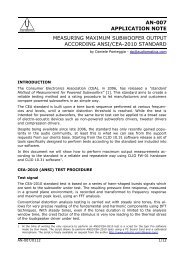
69.14cm). The 1m condition can be set directly with a meter. Fig.10.32 shows the 1m<br />
measurement in black and the previous one in red. Signal level at speaker terminal is<br />
unchanged. The average difference being 3.3dB.<br />
30.0<br />
CLIO<br />
180.0<br />
dBV<br />
Deg<br />
20.0 108.0<br />
10.0 36.0<br />
0.0 -36.0<br />
-10.0 -108.0<br />
Figure 10.32 and 10.33<br />
-20.0 -180.0<br />
20 Hz<br />
100 1k 10k 20k<br />
We now connect CLIO’s input to the speaker terminals and change the y-scale to dBV,<br />
do not change CLIO’s output level, we then obtain Fig.10.33. This is a nearly flat line<br />
that indicates the voltage delivered to the speaker. Remember to save the measurement<br />
to disk. It is worth pointing out that deviation from linearity in this curve due to the power<br />
amp or cable would be compensated for by this procedure. Now we reload the response<br />
at 1m, go to the Process Dialog that will appear as in Fig.10.34.<br />
Figure 10.34<br />
We set the impedance to 8 ohm as this is the nominal impedance of the tweeter. Clicking<br />
OK we obtain Fig.10.35, which is the final result.<br />
126 Chapter 10 - MLS