CLIOwin 7 PCI User's Manual - Audiomatica
CLIOwin 7 PCI User's Manual - Audiomatica
CLIOwin 7 PCI User's Manual - Audiomatica

Create successful ePaper yourself
Turn your PDF publications into a flip-book with our unique Google optimized e-Paper software.
11.4 DISTORTION AND SETTINGS<br />
Sinusoidal stimuli allow CLIO to evaluated distortion in its single harmonic form. If not<br />
Set in Impedance Mode, CLIO always evaluates harmonics from second to fifth and<br />
allows the display of each one separately via its own push buttons. While it is simple to<br />
obtain meaningful distortion figures of electrical devices, measuring Loudspeaker<br />
distortion in normal environments (without anechoic chamber) is not easy. We will only<br />
give some advice here, relying on examples, as the topic is far beyond the scope of this<br />
User <strong>Manual</strong>. To do this we will use CLIO’s FFT Menu in quite an advanced way. Distortion<br />
evaluation is adversely affected by several parameters, two of which are the most<br />
important.<br />
Noise<br />
50 dBSPL of ambience noise, a common figure, usually does not affect Amplitude<br />
evaluation which is usually carried out at an average level of 90dBSPL. This is<br />
particularly true using CLIO Sinusoidal Analysis capability which, by means of DSP<br />
filtering, allows exceptional S/N Ratio. Unfortunately evaluating 1% distortion means<br />
looking for signals that are 40dB lower than the 90dBSPL mentioned above, in the<br />
same order of magnitude as environment noise.<br />
Gating Effects<br />
Device settling time, non perfect delay removal and reflections arriving within the<br />
sampling time (Meter On) seriously affect distortion measurements, creating<br />
artifacts.<br />
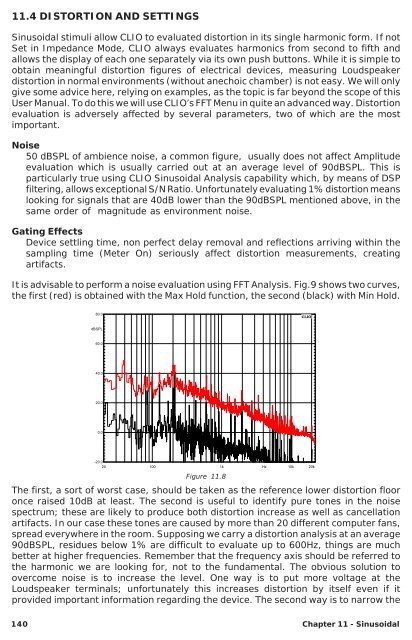
It is advisable to perform a noise evaluation using FFT Analysis. Fig.9 shows two curves,<br />
the first (red) is obtained with the Max Hold function, the second (black) with Min Hold.<br />
80.0<br />
CLIO<br />
dBSPL<br />
60.0<br />
40.0<br />
20.0<br />
0.0<br />
-20.0<br />
20 100 1k Hz<br />
10k 20k<br />
Figure 11.8<br />
The first, a sort of worst case, should be taken as the reference lower distortion floor<br />
once raised 10dB at least. The second is useful to identify pure tones in the noise<br />
spectrum; these are likely to produce both distortion increase as well as cancellation<br />
artifacts. In our case these tones are caused by more than 20 different computer fans,<br />
spread everywhere in the room. Supposing we carry a distortion analysis at an average<br />
90dBSPL, residues below 1% are difficult to evaluate up to 600Hz, things are much<br />
better at higher frequencies. Remember that the frequency axis should be referred to<br />
the harmonic we are looking for, not to the fundamental. The obvious solution to<br />
overcome noise is to increase the level. One way is to put more voltage at the<br />
Loudspeaker terminals; unfortunately this increases distortion by itself even if it<br />
provided important information regarding the device. The second way is to narrow the<br />
140 Chapter 11 - Sinusoidal